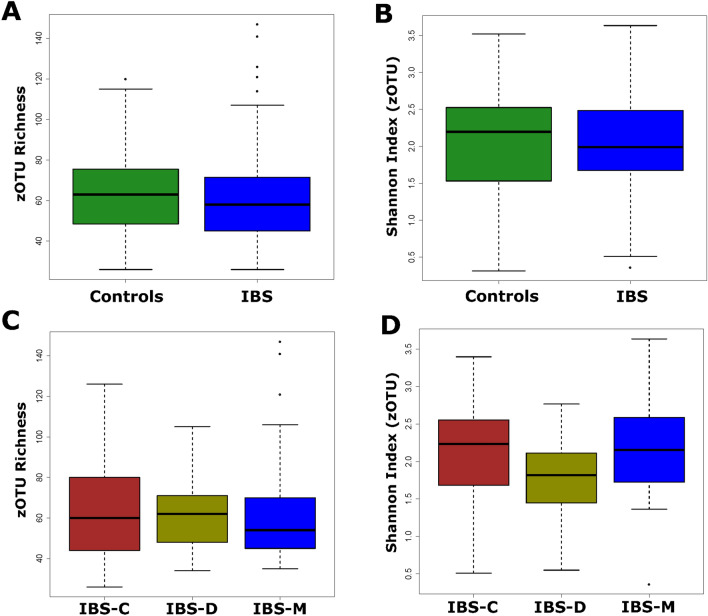
Figure 2.
Mycobiome diversity differences in the analysed population. Two diversity measures were calculated, viz., Richness, and Shannon diversity index. None of the differences were significant. (A) and (B) zOTU richness, and Shannon diversity differences between IBS (n = 80), and control (n = 64) populations. Wilcoxon rank sum test returned nonsignificant p-values of 0.301 and 0.84, respectively. (C) and (D) zOTUotu richness, and Shannon diversity differences between clinical subtypes of IBS (IBS-C: n = 30, IBS-D: n = 21, IBS-M: n = 29). Kruskal–Wallis test returned non-significant p-values of 0.75 and 0.17, respectively.

