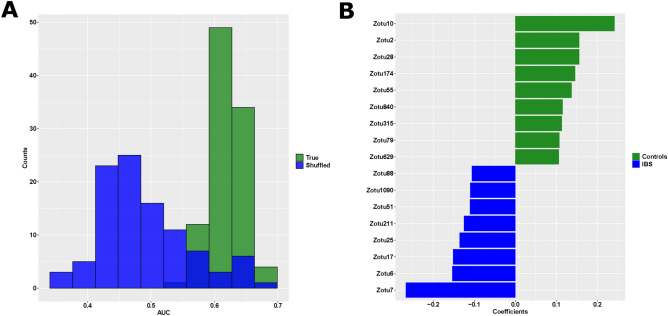
Figure 3.
Predictive power of mycobiome to distinguish between IBS and controls. (A) Distribution of mean Area under the curve (AUC) of each tenfold cross validation, across 100 iterations, using true, and shuffled classes. The difference was significant between True (0.619 ± 0.025), and Shuffled (0.489 ± 0.071) classes (p-value < 0.001). B) Feature coefficients from trained models, significantly different from random are shown. zOTUs with negative coefficients are associated with IBS, and those with positive coefficients are associated with controls (green).

