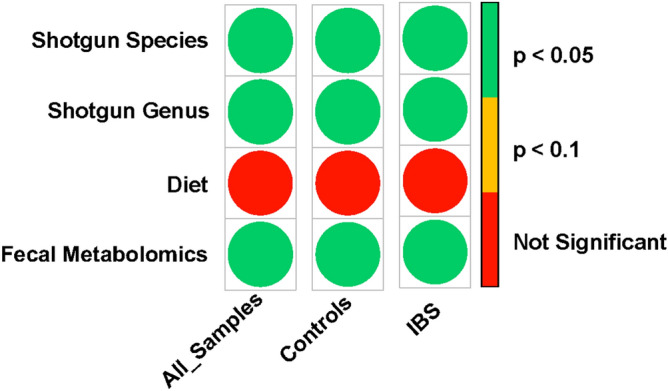
Figure 4.

Co-inertia analysis between mycobiome composition with bacterial composition (All subjects: n = 138, controls: n = 58, IBS: n = 80), food consumption (All subjects; n = 144, controls: n = 64, IBS: n = 80), and fecal metabolome (All subjects; n = 142, controls: n = 62, IBS: n = 80). Mycobiome showed significant association with bacterial composition and fecal metabolome but failed to show significance with food consumption. Degree of association as RV coefficient is presented in supplementary Table S2.
