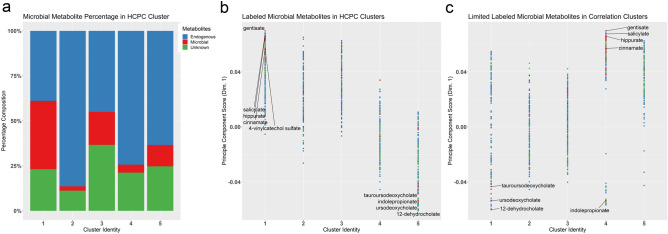
Figure 2.
Hierarchical clustering for 813 metabolites in maternal plasma. (a) Hierarchical Clustering on Principal Components. Percentage composition of microbial metabolites in the hierarchical clusters of the sample PCA loadings, using Ward’s method. Compounds were defined as microbial-derived (red), endogenous-derived (blue), and unknown identity (green). (b) Hierarchical clustering of the sample PCA loadings, plotted against the principle component score for Dimension 1. Plant phenolics were correlated in Cluster 1, and secondary bile acids in Cluster 5; Cluster 3 represented metabolites largely unaffected by alcohol. (c) Hierarchical Clustering on Spearman’s Correlation. The microbial-derived metabolites retained their relationships and plant-derived phenolics were correlated in cluster 4, while the secondary bile acids were in cluster 1. The correlation within Clusters 4 and 5 indicate metabolites having an immediate cellular process affected by the alcohol treatment, whereas the former clusters contain metabolites affected more distantly. For (b) and (c), a positive principal component score indicates the metabolite has increased abundance in response to alcohol; negative scores signify reduced abundance. Sample size is n = 9 control and n = 8 alcohol-exposed dams.

