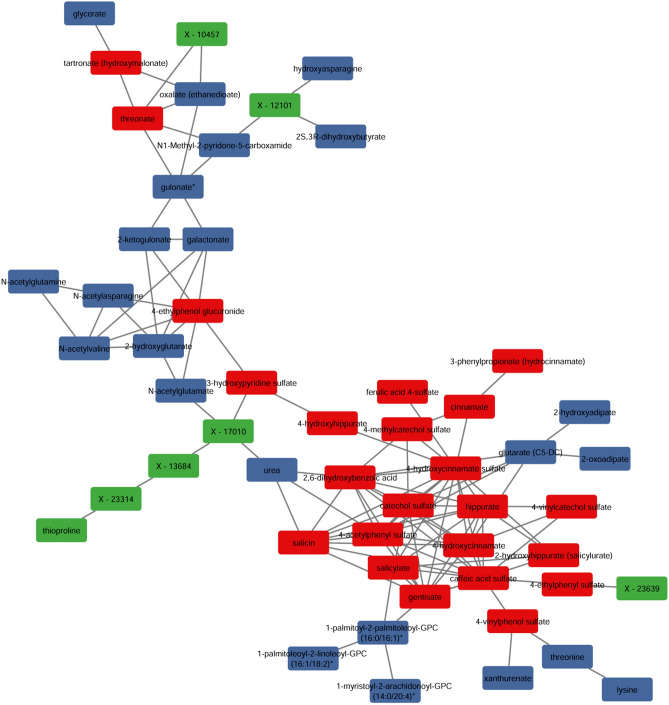
Figure 4.
Positive correlation analysis identifies a network that is enriched in microbial metabolites and is at statistical equilibrium within maternal plasma. Images were generated in Cytoscape (version 3.7.2) using R-Cy3 (version 2.6.3), wherein the network edges represent between-node Spearman’s correlations > 0.90; the distance between nodes indicates strength of interaction. Colors as in Fig. 2; red indicates MDPs, blue indicates endogenous compounds, and green are unknown compounds. The compound X-17010 is likely the MDP 4-vinylcatechol sulfate, based on its molecular mass.

