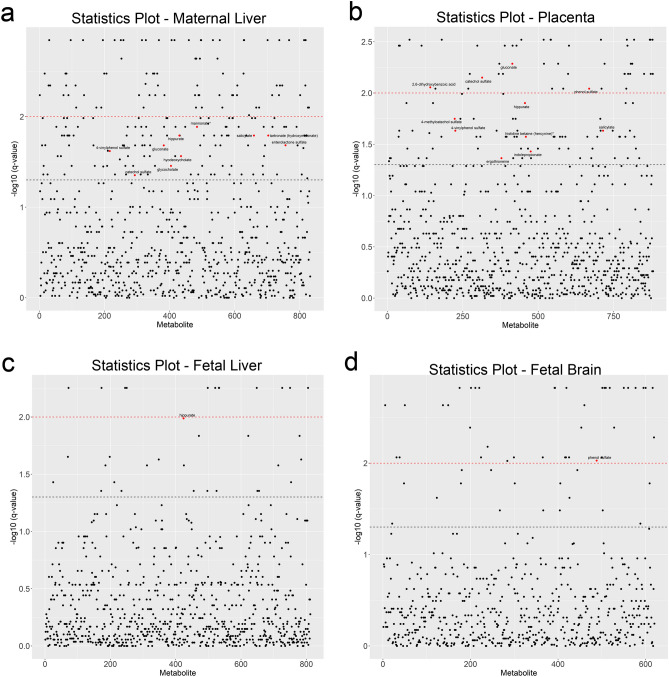
Figure 5.
T-Statistic plot of all metabolites present in maternal and fetal tissues, plotted against their − log10 q-values. Metabolites are arranged along x-axis in alphabetical order. The black dashed line indicates the cut-off for the FDR adjusted value of q < 0.05, and the red dashed line indicates q < 0.01. Red dots indicate microbial-derived metabolites having q < 0.05. (a) T-statistic plot of the 854 metabolites detected in maternal liver. (b) T-statistic plot of the 881 metabolites detected in placenta. (c) T-statistic plot of the 854 metabolites detected in fetal liver. (d) T-statistic plot of the 621 metabolites detected in fetal brain. Sample size is n = 9 control and n = 8 alcohol-exposed dams.

