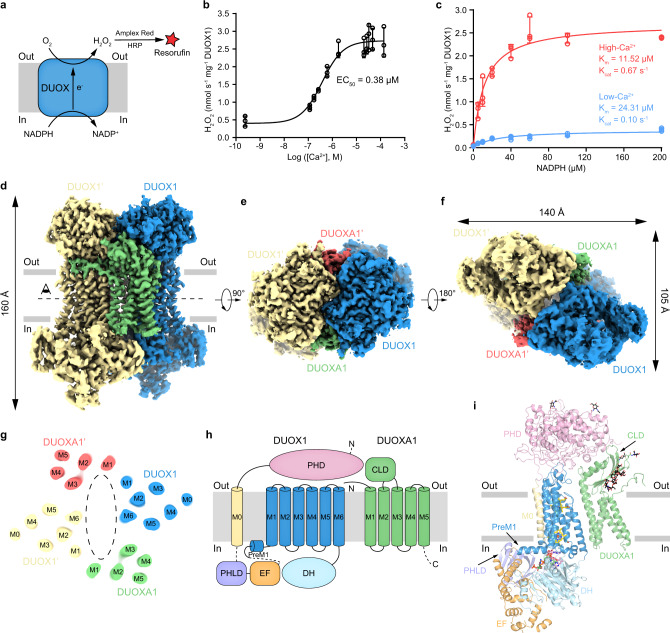
Fig. 1. Structure of human DUOX1–DUOXA1 complex in the high-calcium state.
a Schematic of the DUOX enzymatic assay. In the presence of H2O2 (produced by DUOX), horseradish peroxidase (HRP) converts nonfluorescent Amplex Red to fluorescent resorufin, which is measurable and proportional to H2O2. b Calcium-dependent activation of hDUOX1–hDUOXA1 complex. Data are shown as means ± standard deviations, n = 3 biologically independent samples. Source data are provided as a Source data file. c Steady state enzyme activity of hDUOX1–hDUOXA1 complex as the function of NADPH concentration in the presence or absence of calcium. Data were fit to the Michaelis–Menten equation to obtain the Km and Kcat value. Data are shown as means ± standard deviations, n = 3 biologically independent samples. Source data are provided as a Source data file. d Side view of the cryo-EM map of hDUOX1–hDUOXA1 complex in the high-calcium state. The approximate boundaries of phospholipid bilayer are indicated as gray thick lines. One protomer of hDUOX1 and hDUOXA1 complex is colored as blue and green, the other one is colored as yellow and red, respectively. e A 90° rotated top view compared to d. f A 180° rotated bottom view compared to e. g Top view of the cross-section of the transmembrane layer at the position indicated as a dashed line in d. The large cavity in the transmembrane layer is indicated by dashed oval. For clarity, the cryo-EM map was low-pass filtered to 6 Å. h Topology of hDUOX1 and hDUOXA1 subunits. Transmembrane helices are shown as cylinders, unmodeled disordered regions are shown as dashed lines. The phospholipid bilayer is shown as gray layers. PHD peroxidase homology domain of hDUOX1, PHLD pleckstrin homology-like domain of hDUOX1, EF EF-hand calcium-binding module of hDUOX1, DH dehydrogenase domain of hDUOX1, CLD claudin-like domain of hDUOXA1. i Structure of one protomer of hDUOX1 and hDUOXA1 complex in cartoon representation. The colors of each individual domain are the same as in g. The approximate boundaries of phospholipid bilayer are indicated as gray thick lines. Sugar moieties, hemes, FAD, and NADPH are shown as black, yellow, pink, and green sticks, respectively.

