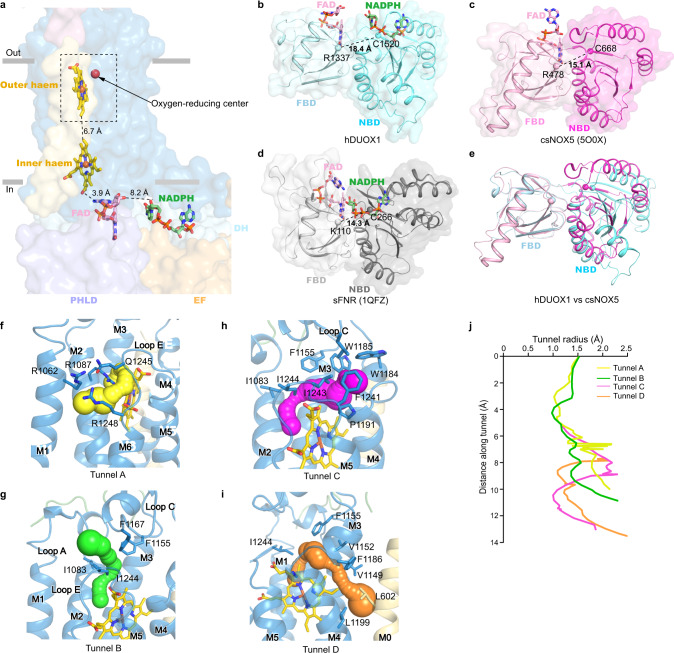
Fig. 3. Electron transfer pathway in hDUOX1 subunit in the high-calcium state.
a The edge-to-edge distances between NADPH and FAD, FAD and inner heme, and two hemes are shown beside dashes. The ligands are shown as sticks, each domain of hDUOX1 are shown in surface, and colored the same as Fig. 1h. Only one hDUOX subunit is shown for clarity. The putative oxygen-reducing center is boxed by dashed lines. b–e The DH domain of hDUOX1 in a relaxed conformation (b), DH domain of csNOX5 (c), and sFNR (d) in a tense conformation. The ligands are shown as sticks, two subdomains (FAD-binding domain, FBD, and NADPH-binding domain, NBD) of DH are shown as cartoon with surface. Distances between Cα atoms of the Arg (Lys in sFNR) of FBD and the Cys of NBD (shown as spheres) are labeled. e Structural comparison of the hDUOX1 DH domain (cyan) and csNOX5 (purple). FBD is used for structural alignment. f–i The close-up view of the putative oxygen-reducing center. Four predicted tunnels for oxygen substrate entrance and product exit are shown as surface in yellow, green, magenta, and orange, respectively. Residues surrounding the tunnels are shown as sticks. j Calculated radii of tunnels shown in f–i. The putative oxygen-reducing center is used as the starting point for calculation.

