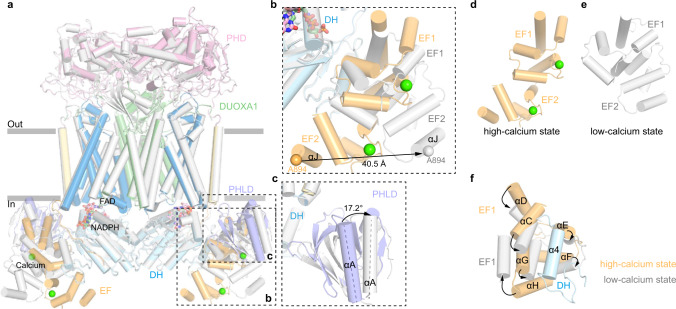
Fig. 5. Conformational change of hDUOX1 complex during calcium activation.
a Structural comparison of hDUOX–hDUOXA1 complex between the high-calcium state (colored) and the low-calcium states (gray). Protein is shown as cartoon. Regions with large conformational changes are boxed by dashed lines. b Close-up view of the conformational changes of EF-hand module. Cα atom of A894 on αJ helix is used as marker to measure the movement of EF2. c Close-up view of the conformational change of PHLD. The angle between αA helices in the high-calcium and low-calcium states was measured. d, e Conformational differences of EF-hand module between the high-calcium state and the low-calcium state. f Reconfiguration of the interface between EF-hand module and α4 helix of DH domain. Arrows denote movements from high-calcium state into the low-calcium state.

