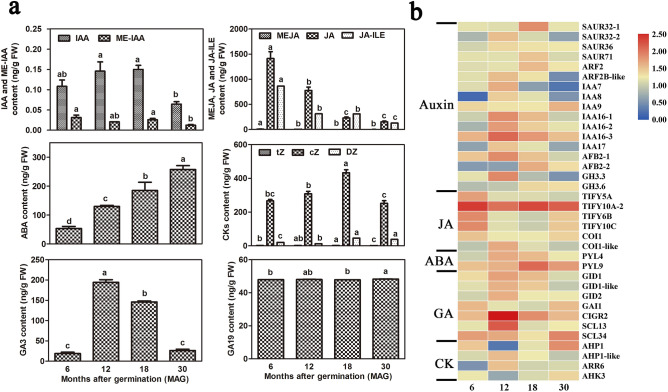
Figure 4.
Trends in endogenous phytohormone contents (a) and expression profiles of hormone related DEGs (b) in C. speciosa roots. (a) Trends in endogenous phytohormone contents. (b) The expression profiles of genes encoding hormone signaling. Heat map indicates the log10-transformed FPKM expression values. Changes in expression level are indicated by a change in color; from blue to red indicates an expression level from low to high. All data shown reflect the mean of three biological replicates (n = 3). Means with different letters in each sample represent a significant difference at 0.05 level.

