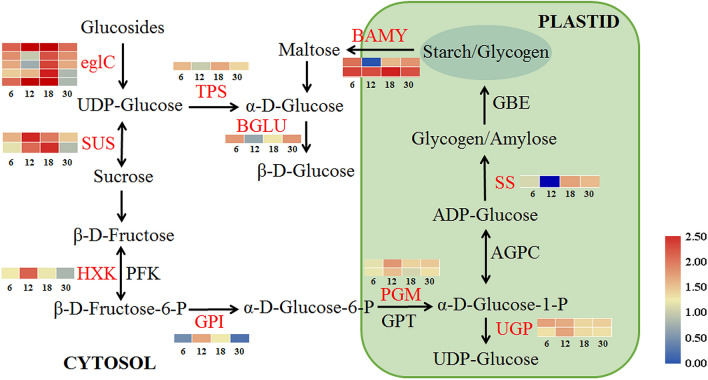
Figure 5.
Expression profiles of DEGs related to sucrose and starch metabolic pathway during C. speciosa root thickening. Heat maps indicate the log10-transformed FPKM expression values. The numbers (6, 12, 18, 30) at the bottom of the heat maps represent the four different developmental ages. Changes in expression level are indicated by a change in color; from blue to red indicates an expression level from low to high. All data shown reflect the mean of three biological replicates (n = 3).

