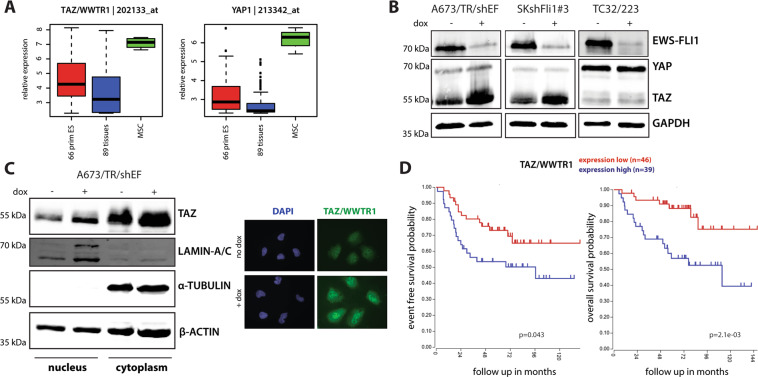
Fig. 1. TAZ expression is repressed by EWS-FLI1 in vitro and correlates with patient outcome in primary EwS.
a Box-plots showing relative expression levels of TAZ and YAP in 66 primary EwS tumours compared to 89 normal tissues and mesenchymal stem cells (MSC). Affymetrix hgu133a microarray expression data from Kauer et al.61. b Representative immunoblots showing YAP and TAZ expression under dox-induced EWS-FLI1low (48 h dox) versus EWS-FLI1high conditions in different EwS cell lines. c Subcellular localization of TAZ in A673/TR/shEF cells upon EWS-FLI1high (no dox) and EWS-FLIlow (48 h dox) conditions was analysed by protein fractionation experiments and immunofluorescence microscopy. One representative immunoblot out of three biological replicates is shown. Lamin A/C and α-tubulin were used as nuclear and cytoplasmic fraction controls, respectively. Immunofluorescent pictures are shown at ×40 magnification. d Kaplan–Meier analysis of huex10t microarray expression data for event-free (chi = 4.08, p = 0.043; left graph) and overall (chi = 9.44, p = 2.1e−03; right graph) survival of 85 EwS patients in relation to TAZ expression. Data (GEO ID: gse6315733) was visualized using the R2 database (http://r2.amc.nl).

