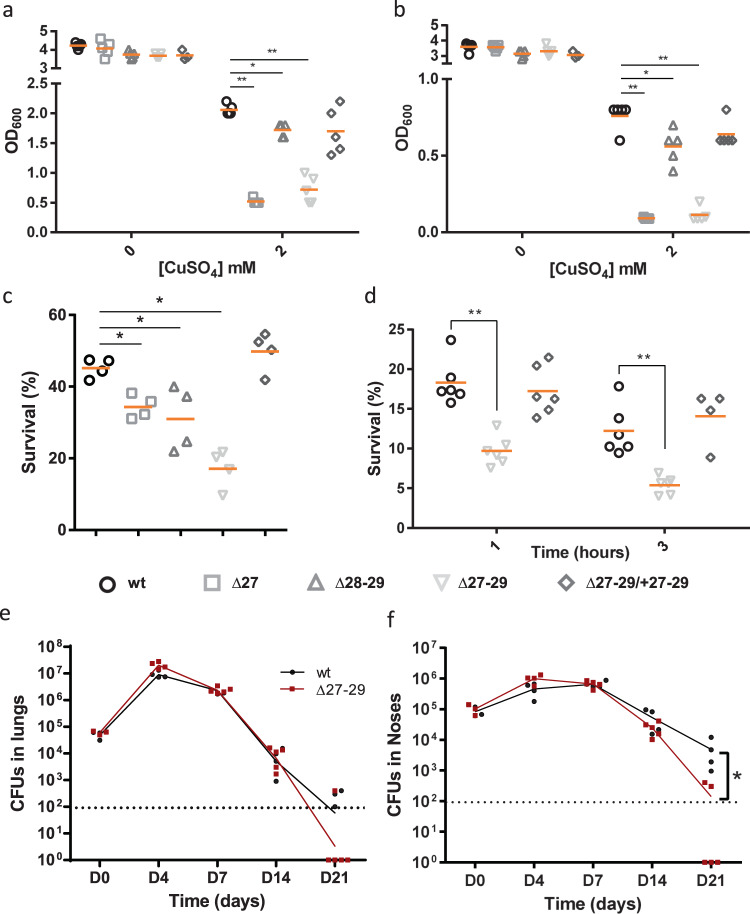
Fig. 4. Role of the operon in B. pertussis and in host–pathogen interactions.
a, b Growth yields of B. pertussis after 24 h in SS medium (a) or in SS medium devoid of glutathione (b), supplemented or not with 2 mM CuSO4. The cultures were inoculated at initial OD600 values of 0.1, and after 24 h the OD600 was determined. Note the different y axis scales between (a) and (b). wt, wild type (parental) strain; ∆27, ∆28-29 and ∆27-29, KO mutants for bp1727 (copZ), bp1728-bp1729 (prxgrx-gorB) and the three genes, respectively. The various strains are represented using different symbols and shades of gray. ∆27-29/+27-29 represents the latter mutant complemented by expression of the operon at another chromosomal locus. The horizontal orange lines represent mean values. c Survival of the same strains to an oxidative shock of 30 min. d Intracellular survival of B. pertussis in THP1 macrophages. The horizontal orange lines represent mean values. See Supplementary Figure S6 for the data of the individual copZ and prxgrx-gorB KO mutants. e, f Colonization of mice lungs (e) and nasopharynxes (f) after nasal infections with the parental strain and the copZ-prxgrx-gorB KO mutant. The numbers of bacteria are indicated for each mouse and organ (black circles: parental bacteria, red squares: mutant). The lines connect the geometric means of the counts at each time point, and the dotted lines indicate the thresholds of detection. For all the assays, statistical analyses were performed using two-tailed Mann-Whitney tests (*, p < 0.05; ** p, <0.005). For panels a and b, 5 biologically independent samples were used. For panels c and d, 4 and 6 biological samples were used, respectively. For panels e and f, 5 and 4 animals per time point were used for the KO and wt strains, respectively.

