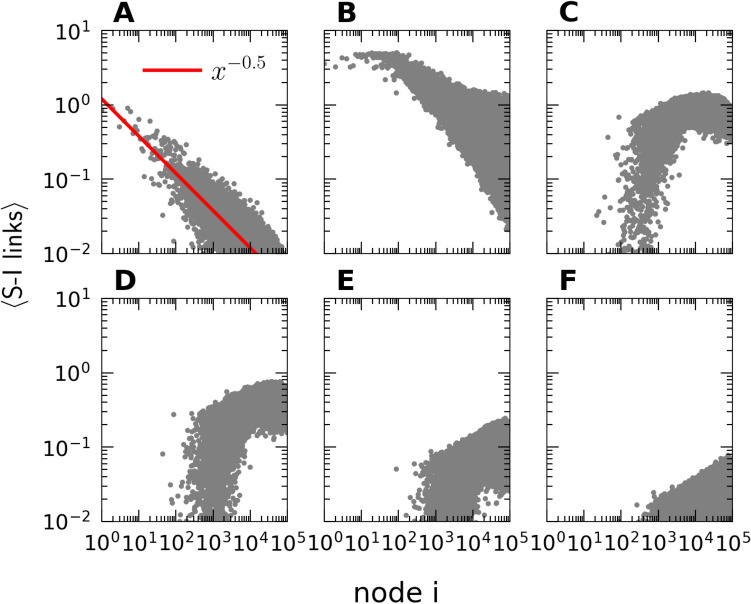
Figure 5.
Distribution of the mean number of susceptible-infectious (SI) connections for the nodes in scale-free contact networks. (A) Network configuration before and (B–F) while the epidemic surge is spreading through the system. (A) at ; (B) after days; (C) after days; (D) after days, when the epidemic has reached its (unmitigated) peak; (E) after days; (F) after days, when only about infectious individuals are left. (The data for each curve were averaged over independent simulation runs).

