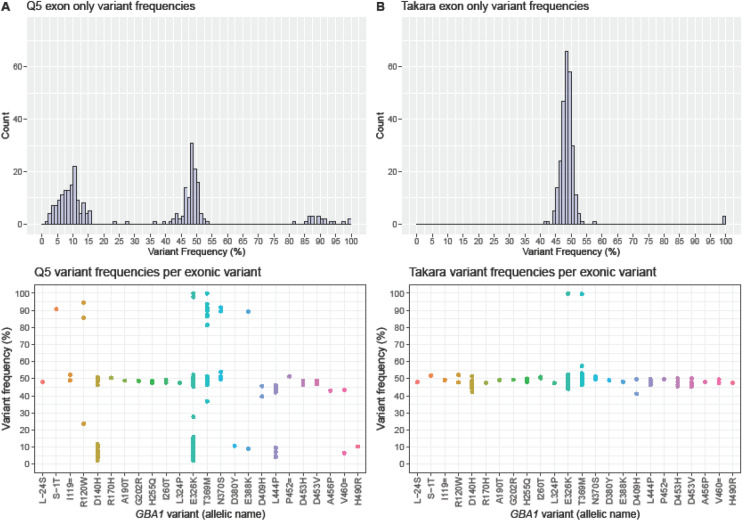
Figure 1.
Comparison of exonic variant frequencies using (A) Q5 polymerase or using (B) TaKaRa polymerase. These are the first 216 samples with a suspected GBA1 exonic variant, initially sequenced using the Q5 polymerase and later repeated with TaKaRa polymerase. The top row shows histograms combining all exonic variants. The bottom row shows dot plots with variant frequencies per specific exonic variant. In normal circumstances, one would only expect a variant frequency around 50% and 100%. 44 samples contained two exonic variants (primarly p.[Asp179His;Glu365Lys] (D140H + E326K)), one sample contained three variants and one sample four. Frequencies below 30% are generally filtered out; the filter was customly set to 2% here. Variant details can be found in our previous publication5.

