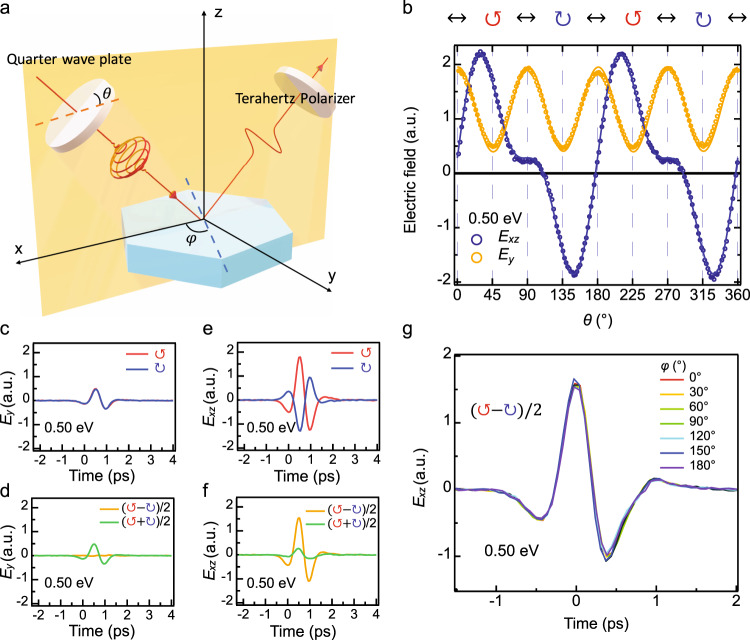
Fig. 2. Schematic depiction of the CPGE experiment and experimental data on CoSi.
a Schematic diagram of experimental setup. b A typical set of xz (in-plane) and y (out-of-plane) components of the peak of the emitted THz time trace as a function of the angle of the quarter-wave plate under light pulses centered at 0.50 eV. The open circles are experimental data and the lines are the best fit constrained by the crystal symmetry of CoSi. c–f A typical set of THz time traces of the out-of-plane (c) and in-plane (e) components under the left-handed and right-handed incident pulses at 0.50 eV. Curves in d and f describe the extracted contribution for CPGE ((E↺ − E↻)/2, orange) and LPGE ((E↺ − E↻)/2, green). g Nearly identical CPGE THz time traces at different sample azimuth angles ϕ at the incident photon energy of 0.50 eV.

