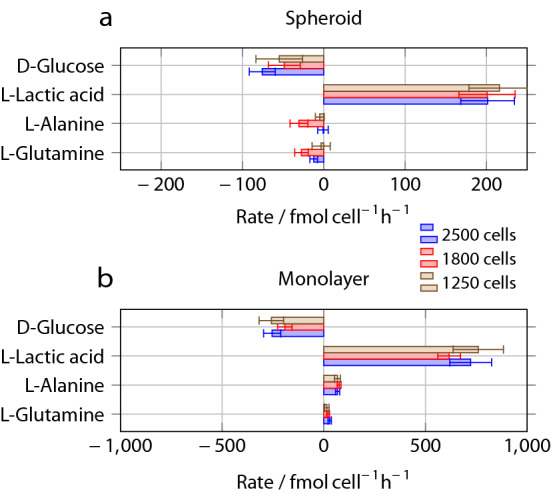
Figure 8.

Production (positive) or consumption (negative) rates per cell, obtained from the NMR spectra for a single spheroid (a) and monolayer culture (b). The scale for the spheroid results is expanded by a factor of 4 compared to the monolayer data. Error bars represent the standard deviation from three separate experiments, and take into account the errors in cell numbers as well as fabrication tolerance error in the sample volume.
