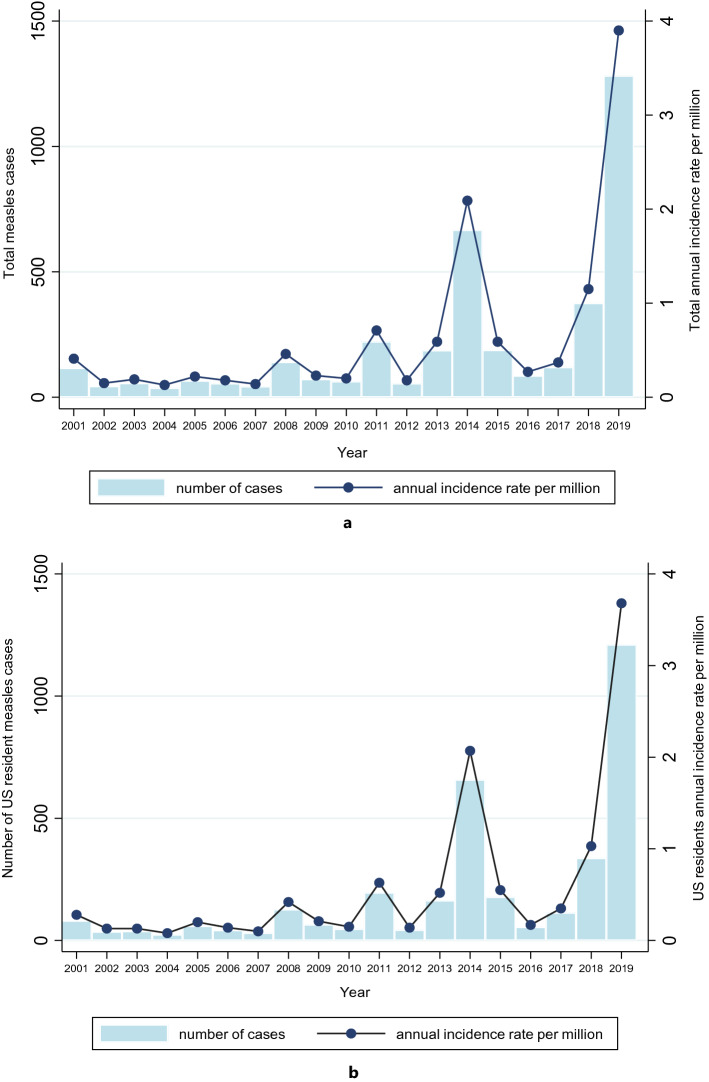
Figure 1.
(a) Total annual incidence rate of measles and total number of measles cases between 2001 and 2019. (b) Annual incidence rate of measles and number of measles cases in US residents between 2001 and 2019. The light blue shading represents the number of cases and the connected line represents the annual incidence rate (AIR) per million population. The total AIR and the AIR in US residents was relatively constant between 2001 and 2013, but there were subsequent peaks in 2014 and 2019.

