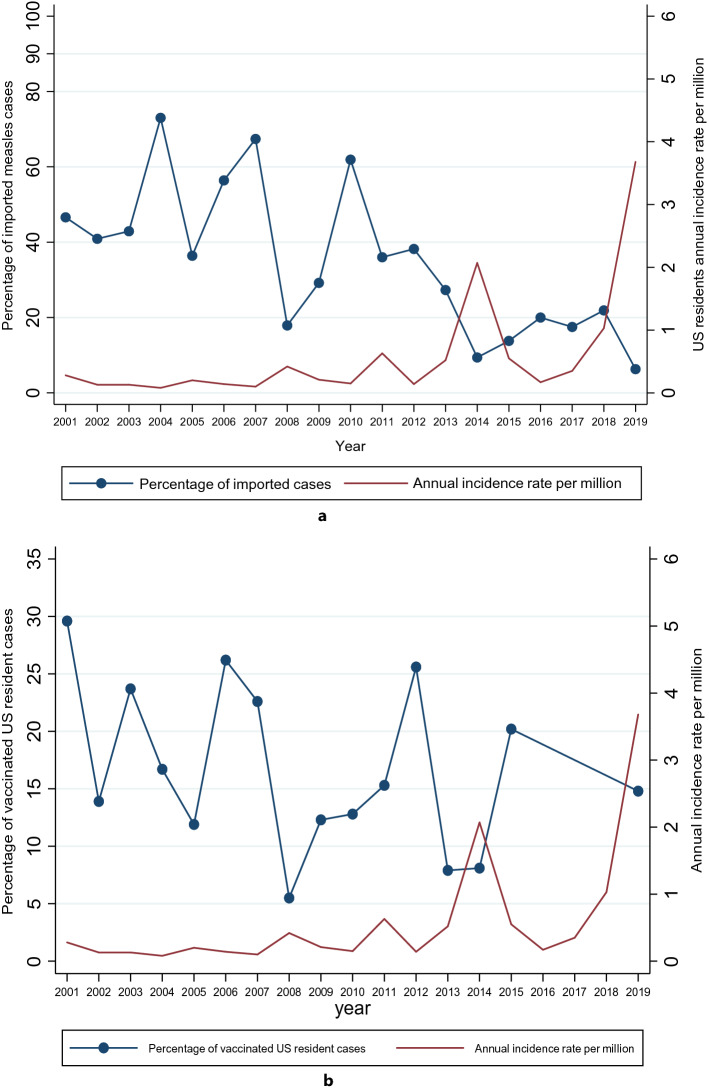
Figure 2.
(a) Annual incidence rate of measles in US residents and the percentage of imported cases between 2001 and 2019. (b) Annual incidence rate of measles in US residents and the percentage of vaccinated cases between 2001 and 2019. The red line represents the annual incidence rate (AIR) per million population and the blue connected line represents the percentage of imported cases and vaccinated respectively. Missing data on the percentage of vaccinated US resident cases for 2016 and 2017 in Fig. 2b. There was a decrease in the percentage of imported cases from 46.6% in 2001 to 6.3% in 2019.

