
Fig. 7. Comparison of ligand tunnels from the active site to the surface of CYP 1A1 in MD simulations of membrane-bound CYP 1A1–CPR complexes and of the CPR-free membrane-anchored-CYP 1A1.
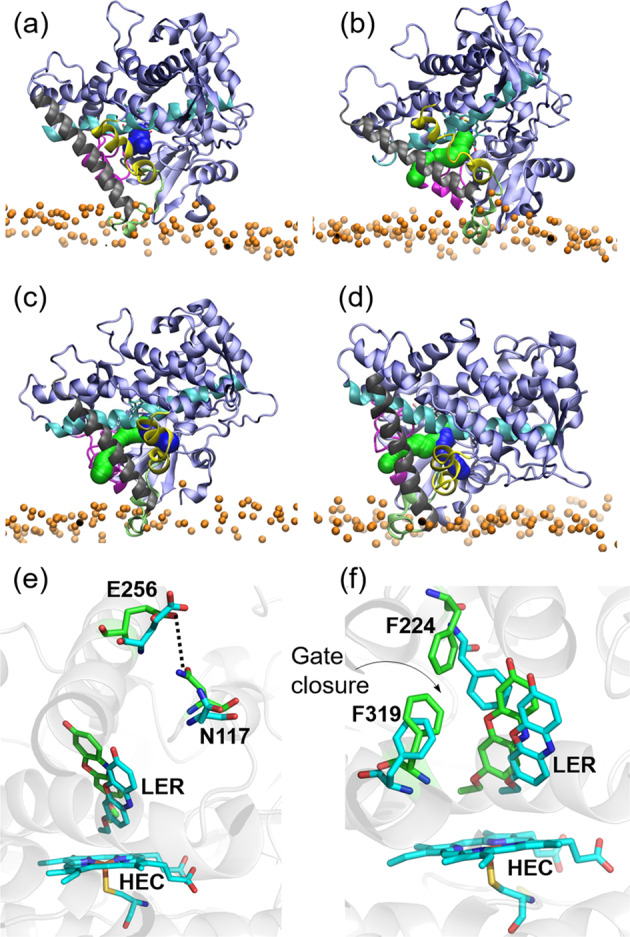
a–d Tunnels calculated by CAVER analysis for a–c three CYP–CPR simulations: a C3; b D2 c D2′; and d CYP 1A1 simulated in a membrane in the absence of CPR. (Color scheme: BC-Loop (105–128): Magenta; F-Helix (211–228): Yellow; FG-Loop (229–245): lime; G-Helix (246–272): Gray; I-Helix (304–336): Cyan. Tunnel 2ac: green; solvent tunnel: blue.) e, f Changes in the active site of CYP 1A1 during simulations of the CYP–CPR complexes in the membrane bilayer resulting in closure of ligand tunnels. Structures are shown before (cyan) and after (green) simulation. e Formation of a hydrogen bond with 95% occupancy between the side chains of N117 and E256 in the C3 simulation blocking tunnel 2ac. The occupancy of this interaction during the other simulations was <30%. f Movement of F224 and F319 in the I-helix in the D2 simulation to make van der Waals contact with an occupancy of 56%, thus blocking the route for ligand passage through the solvent tunnel. In the other simulations, the interaction between F224 and F319 was absent. Instead, there were parallel π–π interactions between the ligand and F224.