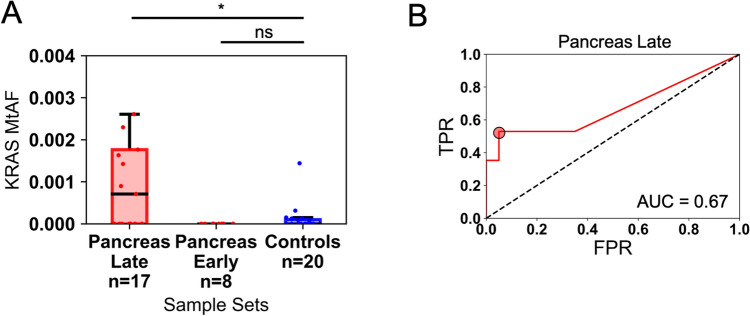
Figure 6.
Classification performance of the KRAS mutant allele fraction (MtAF) in the cfDNA of 17 late-stage or 8 early-stage pancreatic cancer patient plasma sample cases and 20 healthy donors without cancer. (A) Distribution of KRAS MtAFs in cases and controls. Counts are plotted as a standard box and whiskers plot. Pancreas Late has 2 outliers not shown (see Supplementary Table S2 for full list of values). (B) Receiver operating characteristic curve for the classification of late-stage pancreatic cases and control donors using the sample KRAS MtAF. The red circle indicates the optimal MtAF cutoff based on the maximum positive difference between the TPR and FPR (optimal cutoff yielding 53% sensitivity/95% specificity). *p < 0.05; ns not significant, Wilcoxon rank sum one-sided test. AUC area under the curve, FPR false-positive rate, TPR true positive rate.

