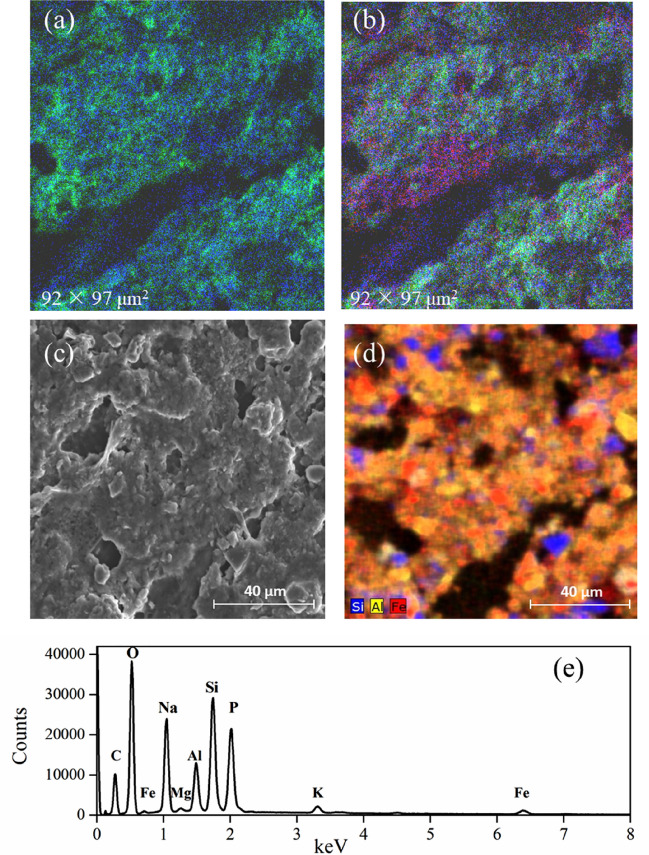
Figure 4.
The morphology and elemental distribution at the interior surface of the biochar-treated rice root. ToF-SIMS images of (a) the sum of CN− and CNO− (green) and Fe-bearing ions (Fe+, FeH+, FeOH+, FeO−, FeOH−, FeO2−, FeO2H−, FeO3−, FeO3H−) (blue); and (b) the sum of Fe-bearing ions (blue), Al-bearing ions (Al+, AlH+, AlO−, AlO2−, Al3H2−, Al3H2O−) (red) and Si-bearing ions (Si+, SiHO+, SiO2−, SiHO3−, Si−, SiHO2−, SiO3−) (green). (c) SEM secondary electron image of the interior surface of the root and (d) EDS mapping showing the elemental distribution for Fe, Al, and Si, (e) EDS spectrum obtained from the whole region shown in Fig. 5c, showing strong signals from Si, P, Al, and Fe.

