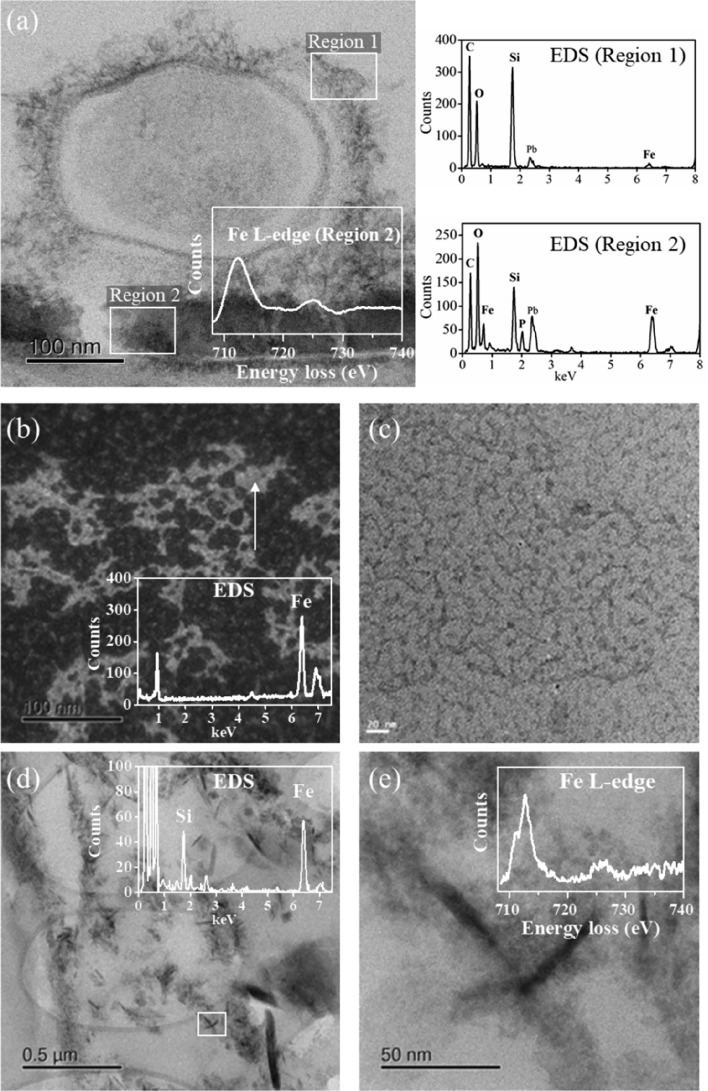
Figure 5.
STEM analyses of a transverse section of a rice root exposed to enhanced biochar. (a) Bright field (BF) image of a microbe attached to the root epidermis. The two rectangular regions of interest are where EDS/EELS analyses were performed. The EDS spectra show a concentration of Si with small amounts of Fe at the surface layer of the microbe (Region 1), and significant concentrations of Si, Fe, and P at the microbe-root interface (Region 2). The Fe L-edge EEL spectrum of region 2 is shown inset in (a) where the edge shape is typical of Fe3O4. (b) High-angle annular dark field (HAADF) image of the intracellular agglomerate of the root. The EDS spectrum from the region arrowed is shown inset where a high concentration of Fe is detected. (c) A magnified BF image of the agglomerate showing matrices containing an iron-rich core with a diameter of around 5 nm. (d) BF image of an intracellular cluster of particles showing high concentrations of Si and Fe detected by EDS analysis. (e) Detailed view of the boxed region in (d) showing the needle-like particles, with the inset showing the Fe L-edge EEL spectrum typical for iron minerals with mixed oxidation states (Fe(II)/Fe(III)).

