
Figure 3.
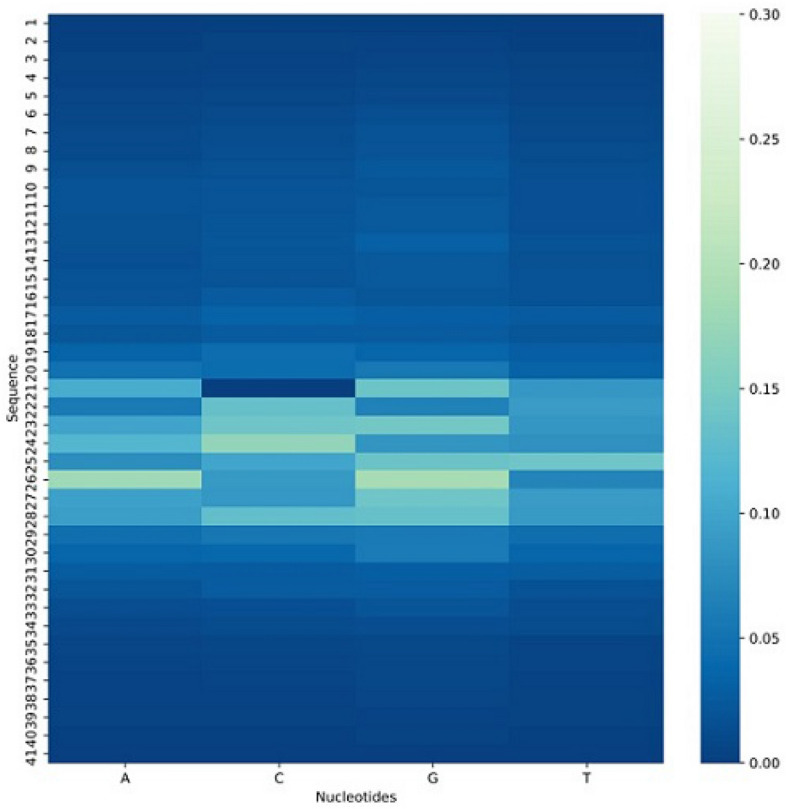
Visualization of heatmap of silico mutation, Where the C nucleotide in the center shows the weak effect on the final prediction as compare to other nucleotides.
Official websites use .gov
A
.gov website belongs to an official
government organization in the United States.
Secure .gov websites use HTTPS
A lock (
) or https:// means you've safely
connected to the .gov website. Share sensitive
information only on official, secure websites.
Visualization of heatmap of silico mutation, Where the C nucleotide in the center shows the weak effect on the final prediction as compare to other nucleotides.