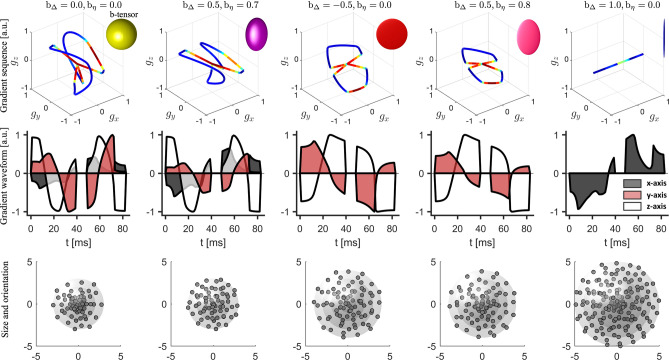
Figure 2.
Illustration of the QTE sequences used to acquire the in vivo dMRI data. The plots in the first row show the 3-dimensional gradients and the shape of the corresponding b-tensors. The shape of b-tensors are determined by two parameters and displayed on top of the plots. The curves are color coded by the slew rate, i.e. the rate of change of gradient sequences. The plots with different colors in the second row illustrate the gradient waveforms along the x-, y-, z-axises, respectively. In row three, the magnitude and orientation of a point on the spheres correspond to the trace, i.e. b-value, and an eigenvector of a b-tensor. The maximum b-values for the five types of b-tensors are equal to 3, 3, 4, 4, 5 , respectively. The spherical or planar shapes in the top-right corner of figures in the top row represent the “shape” of b-tensors instead of the diffusion tensors as in Fig. 1.

