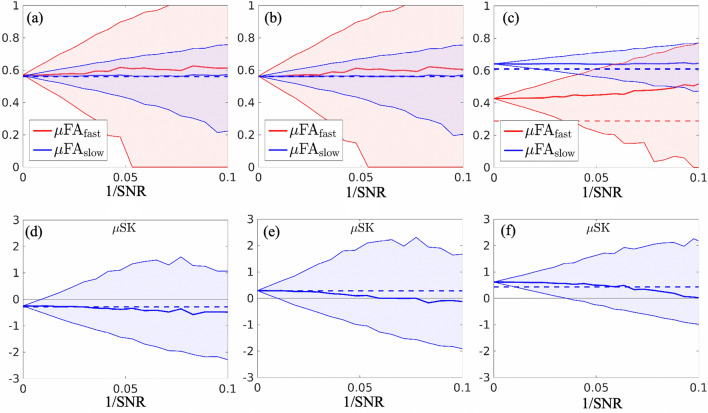
Figure 4.
Illustration of estimated dMRI indices of the three synthetic DTDs in Fig. 1 using the diffusion encoding sequences shown in Fig. 2 with different levels of measurement noise. The horizontal axis of these plots illustrates the inverse signal-to-noise ratio (1/SNR). The upper and lower boundary of the red and blue shaded areas in (a)–(c) illustrate the 25% and 75% percentiles of the 5000 sampled values of and of the three synthetic structures, respectively. The red and blue solid lines show the median values of the sampled of and values with the underlying true values indicated by the dashed lines. Similarly, the shaded plots in (d)–(f) illustrate the 25% and 75% percentiles of the sampled values with the median and true values shown by the solid and dashed lines.

