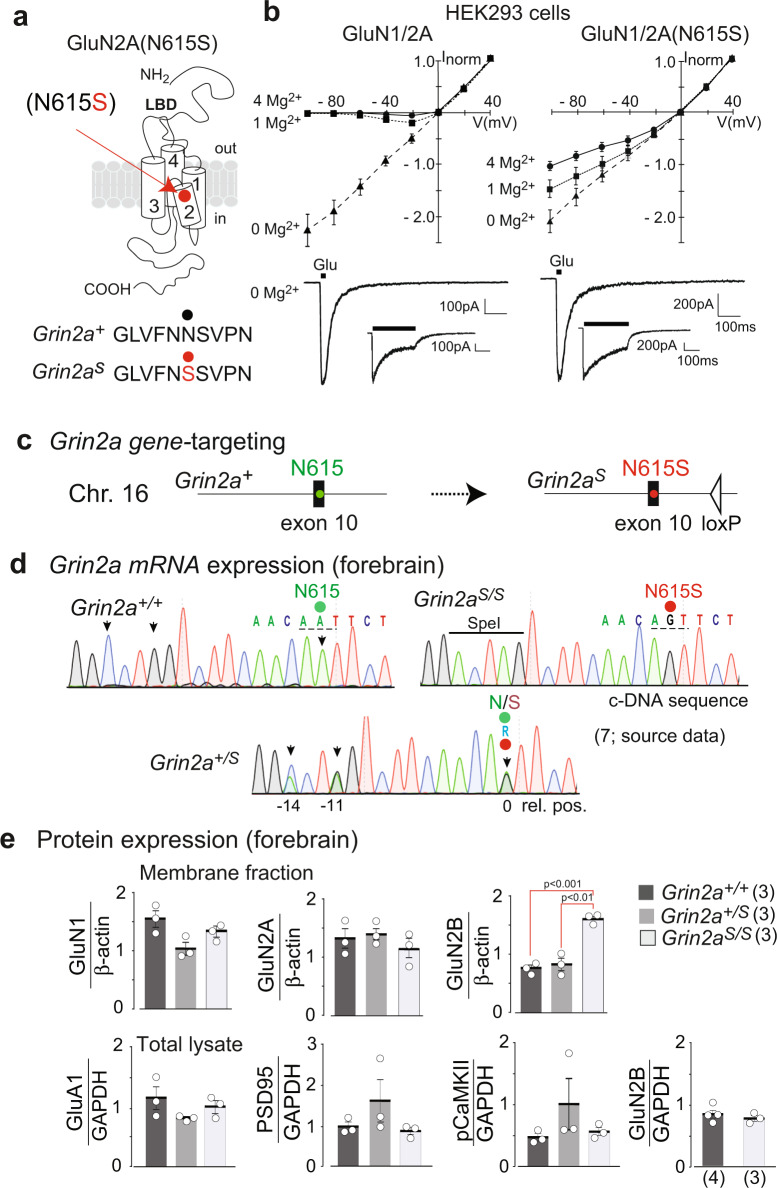
Fig. 1. GluN2A(N615S) containing NMDAR expression in vitro and in vivo.
a The position of N615 in the membrane segment M2 is depicted together with the three channel-forming trans-membrane segments M1, 3, and 4. b In HEK293 cells, recombinantly expressed GluN1/GluN2A and GluN1/GluN2A(N615S) channels were activated by fast glutamate application (1 mM; in the continuous presence of the co-agonist glycine, 10 µM) at holding potentials from –100 to +40 mV in different extracellular Mg2+ concentrations. NMDAR-mediated peak currents were normalized to those obtained at +40 mV. Data points represent mean ± SEM for n = 4–7 different HEK293 cells. Representative current traces evoked in 0 mM Mg2+ at – 60 mV, with 20 and 600 ms applications, are shown below the IV plots and were used to determine the current kinetics (Supplementary Table 1). c Schematic view of the A to G replacement in exon 10 of the mouse Grin2a gene. d Reverse transcription PCR (RT-PCR)-sequence analyses of total brain mRNA show the A-to-G mutation in pos. 0 and two diagnostic silent mutations at pos. –11 and –14 in the pore loop encoding gene segment in Grin2a+/+, Grin2aS/S, Grin2a+/S mice. In Grin2a+/S mice, the overlay of two different colored “nucleotide” peaks, at position 0, –11, and –14 indicate equimolar amounts of mRNA from the Grin2a+ and the targeted Grin2aS alleles. e Immunoblots of forebrain protein lysates of 4-week-old mice (Supplementary Fig. 2) indicate no genotype-specific differences of GluN1, GluN2A, and the AMPAR subunit GluA1 expression relative to the β-actin levels (p > 0.05). The levels of PSD95 and αCaMKII (in its phosphorylated state, pCaMKII) are also comparable between genotypes relative to the GAPDH expression. The GluN2B expression level in the membrane fraction was significantly increased in Grin2aS/S mice when compared to Grin2a+/+ and Grin2a+/S mice but not in the levels of total protein lysates (for statistics: Supplementary Statistics to Fig. 1). The number of mice is given in brackets. Error bars represent mean ± SEM.

