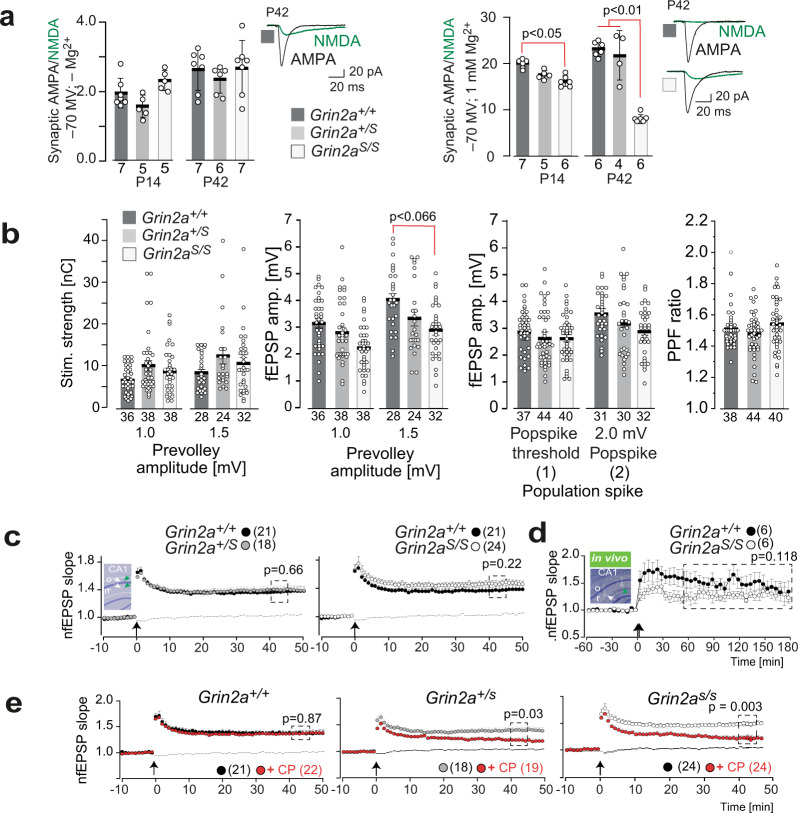
Fig. 2. Hippocampal synaptic transmission and plasticity in Grin2aS/S and Grin2a+/S mice with the GluN2A(N615S) mutation.
a (left) In the absence of extracellular Mg2+ the synaptic AMPA/NMDA ratio of CA1 pyramidal cells in acute hippocampal slices is not altered in Grin2a+/S and Grin2aS/S mice compared to control littermates. (right) In the presence of extracellular Mg2+ the strong reduction of the AMPA/NMDA ratio in Grin2aS/S mice relates to the increased NMDA currents at CA1 synapses (Tukey’s test). Example traces are depicted to the right of each bar graph. Data from the same experimental group were pooled across animals and are presented as mean ± SEM (see also ref. 35) with p < 0.05 being designated as statistically significant. Numbers in bar graphs indicate the number of slices. b Paired-pulse facilitation at CA3-to-CA1 synapses excluded strong alterations of presynaptic function in mutant mice. The stimulation strengths (in nC) necessary to elicit a pre-volley of 1.0 and 1.5 mV and the resulting fEPSP amplitudes were comparable in all genotypes but showed only a trend towards lower fEPSP amplitudes recorded at 1.5 mV pre-volley amplitudes in Grin2aS/S mice. The fEPSP amplitudes necessary to elicit a just detectable population spike (1) and a population spike of 2 mV amplitude (2) and the paired-pulse facilitation ratio (PPF) at an interstimulus interval of 50 ms did not indicate any synaptic impairments in Grin2aS/S and Grin2a+/S mice compared to WT littermates. The number of slices is indicated in the bar graphs or in brackets. c Field LTP (fLTP) at CA3-to-CA1 synapses, induced by tetanic stimulation in slices (1 s; 100 Hz; arrow), was comparable in all three genotypes. The inset in c gives a schematic view of the stimulating (white arrow) and the recording (green arrow) electrode positions in str. radiatum (r) and str. oriens (o). d Similarly, CA1-to-CA3 fLTP (induction: 2 × 1 s; 100 Hz; arrow) in freely moving mice was comparable between Grin2aS/S and Grin2a+/+ mice. The inset shows a Nissl-stained slice of one recorded mouse post mortem. e In mutant mice, but not in control littermates, the GluN2B-containing NMDAR contributes significantly to the magnitude of LTP, since LTP was significantly reduced by the GluN2B-specific antagonist CP101,106 (CP). Recordings of the non-tetanized control pathway in c and e are given as dashed lines. Error bars represent mean ± SEM (for statistics: Supplementary Statistics to Fig. 2).

