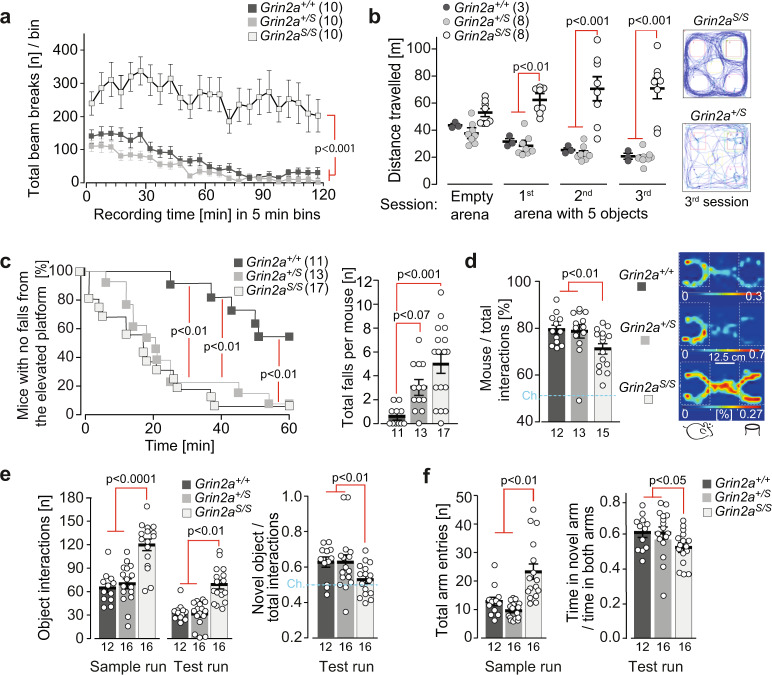
Fig. 7. Grin2aS/S mice are hyperactive and show increased attention and lack of inhibition.
a The total locomotor activity during the entire 2 h session in a novel environment was enhanced in Grin2aS/S mice. b Similarly, the exploratory behavior of Grin2aS/S mice remained high in all three successive 6 min exposure sessions to five novel objects (ITI = 4 min), as exemplified by traces of the animal’s movement on the right. c (left) The time of first fall (Cliff Avoidance Reflex, CAR) was significantly reduced for Grin2aS/S and Grin2a+/S mice. c (right) In a 60-min session Grin2aS/S mice showed a significantly increased number of falls compared to wild-type mice. d (left) In the three-chamber sociability test Grin2aS/S mutants had a significantly reduced preference to explore the stimulus mouse over the object compared to Grin2a+/S and Grin2a+/+ littermates. d (right) Occupancy heat maps in the three-chamber sociability test show a representative example of a Grin2aS/S mouse with a reduced preference for another mouse versus an inanimate object. The social preference is visible for Grin2a+/+ and Grin2a+/S mice. The occupancy is color-coded separately for each group and translates to a % given in white numbers on the key for each genotype. e During the novel object recognition test, Grin2aS/S mice displayed significantly more interactions with the two objects in both the sample and test runs compared to their Grin2a+/S and Grin2a+/+ littermates. During the test run, only the Grin2a+/S and Grin2a+/+ showed a significant preference for the novel object over the familiar object. There was no significant novelty preference in the Grin2aS/S mice. f During the sample run in the Y-maze Grin2aS/S mice made significantly more total arm entries. In the test run, Grin2a+/+ and Grins2a+/S showed a preference for the unexplored novel Y-maze arm, whereas Grin2aS/S mice showed a lack of novelty preference. The numbers of mice are shown in brackets or below the bars of bar graphs. Chance levels (Ch.) are indicated by dashed lines. Error bars represent mean ± SEM (for statistics: Supplementary Statistics to Fig. 7).

