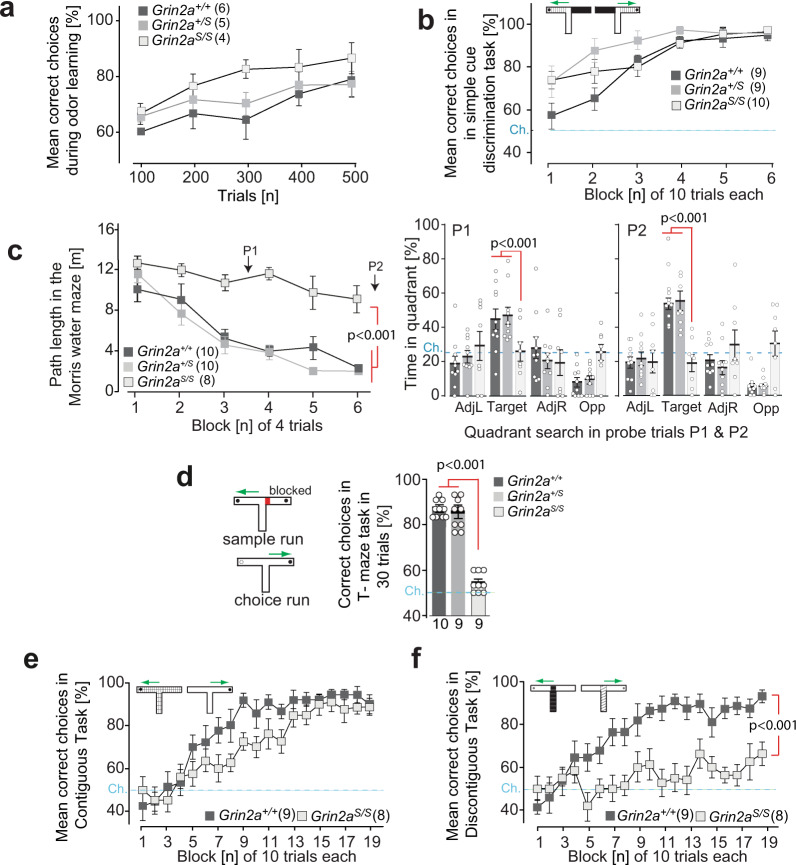
Fig. 8. Associative learning in GluN2A(N615S) expressing mice.
a Odor discrimination. Grin2aS/S learned to discriminate between amyl acetate and ethyl butyrate in a rewarded go/no go-paradigm (250 trials for each odor stimulus, pseudo-randomized, and counterbalanced by stimulus identity across animals). Acquisition was similar for all three genotypes. b Simple visuo-tactile discrimination. Grin2aS/S mutant mice showed normal acquisition in the simple discrimination T-maze task and were able to associate a specific visuo-tactile insert (black foam versus light blue toweling) with a milk reward. c Morris watermaze. In the standard Morris watermaze task (left graph) the path length to reach the hidden platform decreased across training blocks for Grin2a+/+ and Grin2a+/S mice but not for Grin2aS/S mice. Two probe trials were conducted after 12 and 24 training trials (P1 and P2, respectively) during which the platform was removed from the pool. At both P1 and P2 (right bar graphs) the Grin2aS/S mice failed to search for the platform in the target quadrant. AdjL adjacent left, Target fixed location of the hidden escape platform during acquisition, AdjR adjacent right, Opp opposite of target quadrant. Dashed lines indicate chance levels. d Rewarded alternation. (left) In the T-maze rewarded alternation task (right) spatial working memory performance was substantially impaired in Grin2aS/S mice. e Contiguous task. In the contiguous version of the conditional T-maze task (with floor inserts covering the entire T-maze; white Perspex versus gray wire mesh), Grin2a+/+ and Grin2aS/S mice were able to associate a particular floor insert with the location of the reward in either the left or the right goal arm. f Discontiguous task. Separate groups of mice were trained in the discontiguous version of this conditional task, in which the floor insert cues were now limited to the start arm only. Grin2a+/+ mice readily acquired the task, but Grin2aS/S mice failed to learn. The numbers of mice are shown in brackets or below the bars of bar graphs. Chance levels (Ch.) are indicated by dashed lines. Error bars represent mean ± SEM (for statistics: Supplementary Statistics to Fig. 8).

