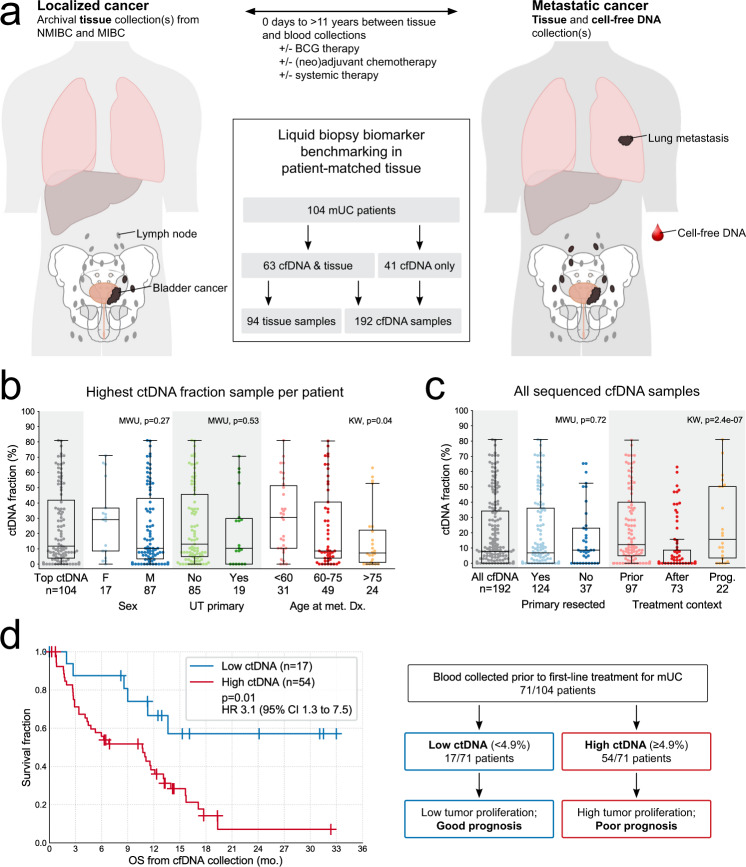
Fig. 1. Cohort summary and abundance of circulating tumor DNA (ctDNA).
a Cell-free DNA (cfDNA) and tissue samples were collected from 104 metastatic urothelial carcinoma (mUC) patients. Anatomy diagram obtained from Cancer Research UK/Wikimedia Commons, available under a Creative Commons Attribution-Share Alike 4.0 International license: https://commons.wikimedia.org/wiki/File:Diagram_showing_advanced_bladder_cancer_CRUK_441.svg. b Abundance of ctDNA in relation to patient characteristics. Only the highest ctDNA fraction sample from each patient is shown. c Impact of treatment status (at the time of cfDNA collection) on ctDNA abundance. Prior cfDNA collected pre-treatment initiation, after cfDNA collected post-treatment initiation, and Prog. cfDNA collected near the time of documented disease progression (see “Methods” section). d Kaplan–Meier survival analysis in 71 mUC patients with cfDNA collected prior to first-line systemic therapy. The highest ctDNA fraction sample from each patient is represented if multiple pre-treatment samples were available. Stratification is based on the 25th percentile across the represented samples (4.9%). Statistical significance was measured using Cox proportional hazards regression analysis. All boxplots in (b) and (c) are centered at the median, with the box spanning the first to third quartile, and minima and maxima extending to 1.5× IQR. MWU two-sided Mann–Whitney U test, KW Kruskal–Wallis test, and UT upper tract. Source data for (b) and (c) are provided as a Source Data file.

