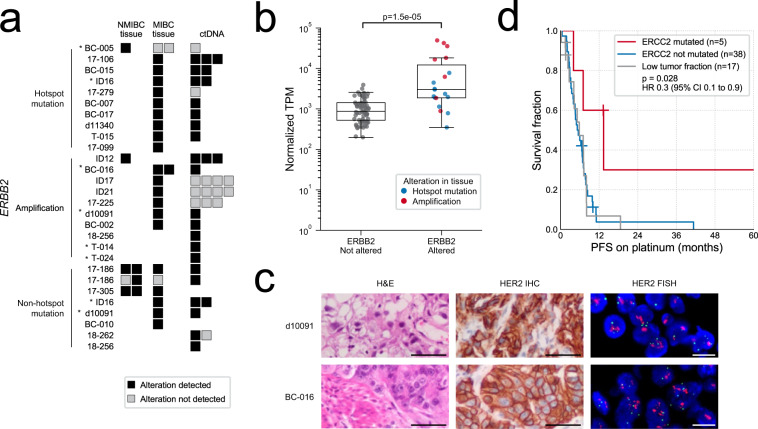
Fig. 5. Evaluation of ERBB2 and ERCC2 status in circulating tumor DNA (ctDNA) and tumor tissue.
a Detection of alterations in ERBB2. Asterisks indicate TMB > 30 mutations/Mb. Samples with a tumor fraction of zero are not shown. NMIBC non-muscle-invasive bladder cancer, MIBC muscle-invasive bladder cancer. b ERBB2 expression levels in 19 tissue samples with activating alterations, compared to 67 tissue samples without ERBB2-activating alterations detected via targeted DNA-sequencing. P value calculated with two-sided Mann–Whitney U test. Boxplots are centered at the median, with the boxes spanning the first to third quartile, and minima and maxima extending to 1.5× IQR. TPM transcripts per million. c Tissue staining for ERBB2 (HER2) amplifications detected in ctDNA: hematoxylin and eosin (H&E), and positive immunohistochemistry (IHC) and fluorescence in situ hybridization (FISH). IHC and FISH were performed once per patient specimen using a clinically validated test. Scale bars correspond to 50 µm (H&E and IHC) and 10 µm (FISH). d Kaplan–Meier survival analysis for progression-free survival (PFS) in the subset of patients treated with platinum chemotherapy, stratified by ERCC2 mutation status. All but one mutation fell within a helicase domain. Statistical significance was measured using Cox proportional hazards regression analysis; patients with low tumor fractions (insufficient to detect protein-altering somatic mutations) were excluded from the survival regression. Source data for (b) are provided as a Source Data file.

