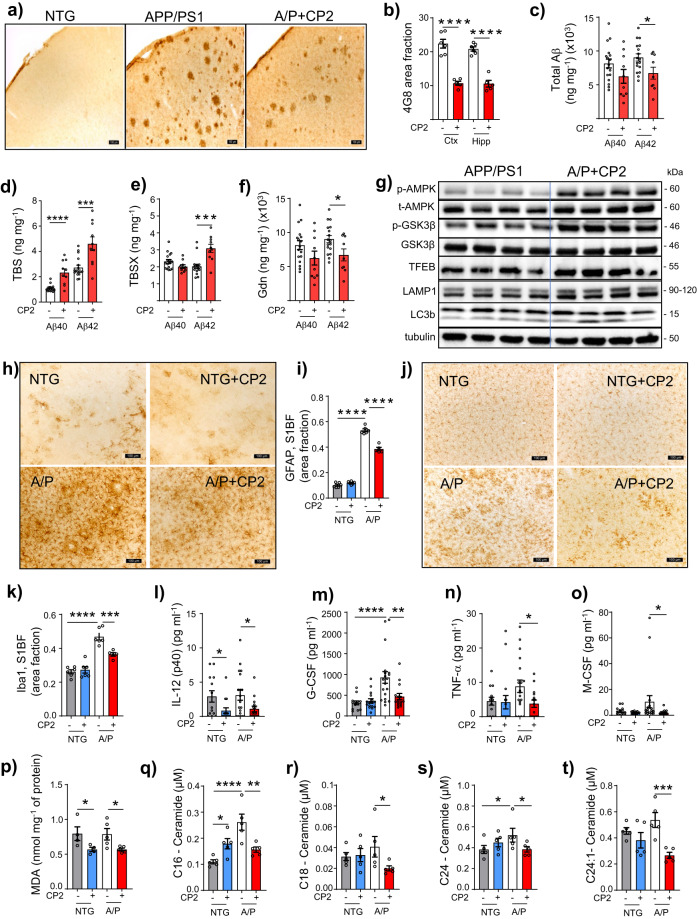
Fig. 4. CP2 treatment reduces levels of Aβ, inflammation and oxidative stress in symptomatic APP/PS1 mice.
a Representative images of Aβ plaques visualized using 4G8 antibody in S1BF cortex of NTG and APP/PS1 mice. Scale bar, 100 μm. b Levels of Aβ plaques are significantly reduced in S1BF and hippocampus in CP2-treated APP/PS1 mice estimated using 4G8 antibody shown in a. APP/PS1 (Ctx), n = 6 mice per group; APP/PS1 + CP2 (Ctx), n = 5 mice per group; APP/PS1 (Hipp), n = 6 mice per group; APP/PS1 + CP2 (Hipp), n = 5 mice per group. c–f Differential centrifugation and ELISA revealed decreased levels of total Aβ42 in brain homogenates from CP2-treated APP/PS1 mice (c). Levels of soluble Aβ40 and 42 obtained using TBS (d) and TBSX (e) fractions were increased, while concentrations of the least soluble Aβ40 and 42 were decreased in brain fractions obtained using Gdn (f). c–f APP/PS1, n = 17 mice per group; APP/PS1 + CP2, n = 10 mice per group. g CP2 treatment induces AMPK activation, reduces the activity of GSK3β, and activates autophagy in brain tissue of APP/PS1 mice. Each lane represents an individual mouse. h, j Representative images of GFAP + (h) and Iba1 + (j) staining in the S1BF in vehicle and CP2-treated NTG and APP/PS1 mice. Scale bar, 100 µm. i, k Quantification of GFAP (i) and Iba1 (k) staining from h and j, respectively. NTG, n = 6 mice per group; NTG + CP2, n = 6 mice per group; APP/PS1, n = 6 mice per group; APP/PS1 + CP2, n = 4 mice per group. l–o CP2 reduces pro-inflammatory markers in plasma of NTG and APP/PS1 mice. NTG, n = 13 mice per group; NTG + CP2, n = 17 mice per group; APP/PS1, n = 20 mice per group; APP/PS1 + CP2, n = 16 mice per group. p Levels of lipid peroxidation measured using MDA assay were significantly reduced in brain tissue of CP2-treated NTG and APP/PS1 mice. NTG, n = 4 mice per group; NTG + CP2, n = 4 mice per group; APP/PS1, n = 5 mice per group; APP/PS1 + CP2, n = 5 mice per group. q–t Concentrations of ceramides (C16, C18, C24, C24-1) were significantly reduced in blood collected from CP2-treated APP/PS1 mice and measured using targeted metabolomics. n = 5 mice per group. All mice were 23-month-old. Data are presented as mean ± S.E.M. A two-way ANOVA with Fisher’s LSD post-hoc test was used for data analysis. For the comparison between vehicle and CP2-treated APP/PS1 groups (b–f), an unpaired Student t-test was used for statistical analysis. *P < 0.05; **P < 0.01; ***P < 0.001; ****P < 0.0001.

