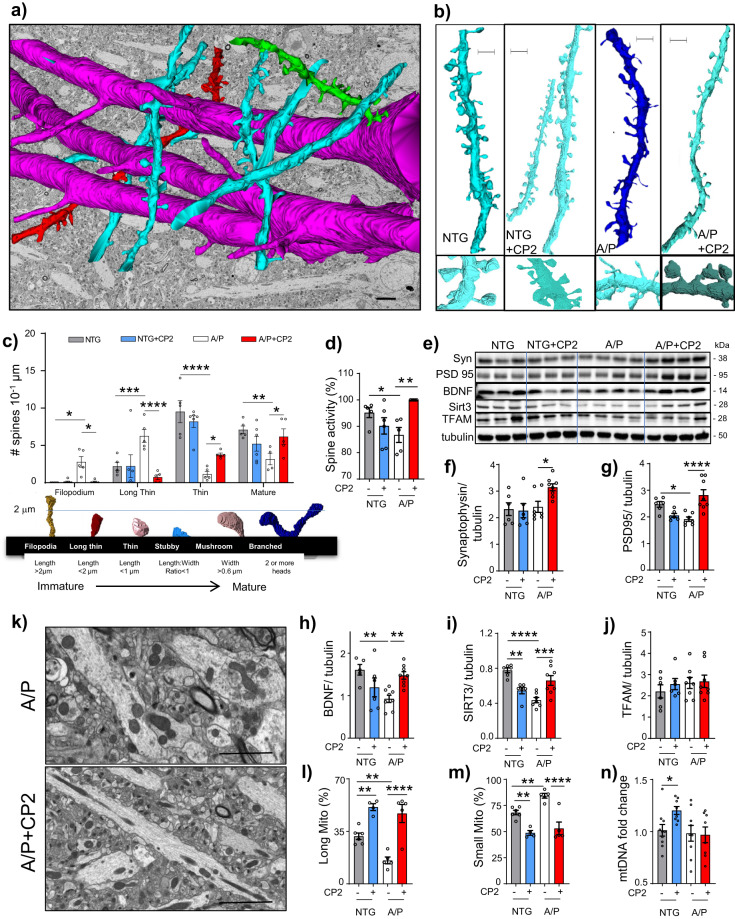
Fig. 6. CP2 treatment restores dendritic spine morphology and mitochondrial dynamics in the hippocampus of APP/PS1 mice.
a Representative image of 3DEM reconstruction of axons (red) and dendrites (green, blue) from the CA1 hippocampal region of a NTG mouse. Reconstruction is superimposed on 2DEM from the same brain. Scale bar, 5 μm. b Representative 3DEM reconstructions of dendrites from CA1 region of NTG and APP/PS1 mice. Scale bar, 1 μm. c Quantification of dendritic spine morphology in vehicle and CP2-treated NTG and APP/PS1 mice. Mature dendritic spines included stubby, mushroom and branched. d Quantification of active synapses visualized using 3DEM. e Western blot analysis in the hippocampal tissue assaying levels of synaptophysin (Syn), BDNF, PSD95, TFAM, and SIRT3. f–j Quantification of proteins from e. k Representative 2DEM micrographs of mitochondria in the hippocampus of CP2-treated and vehicle-treated APP/PS1 mice are used for quantifying mitochondrial morphology. l, m CP2 treatment increases the number of elongated mitochondria and decreases the number of small organelles. n CP2 increased mitochondrial DNA copy number in NTG mice. Data are presented as mean ± S.E.M. A two-way ANOVA with Fisher’s LSD post-hoc test was used. n = 5 per group. *P < 0.05, **P < 0.01, ***P < 0.001, ****P < 0.0001.

