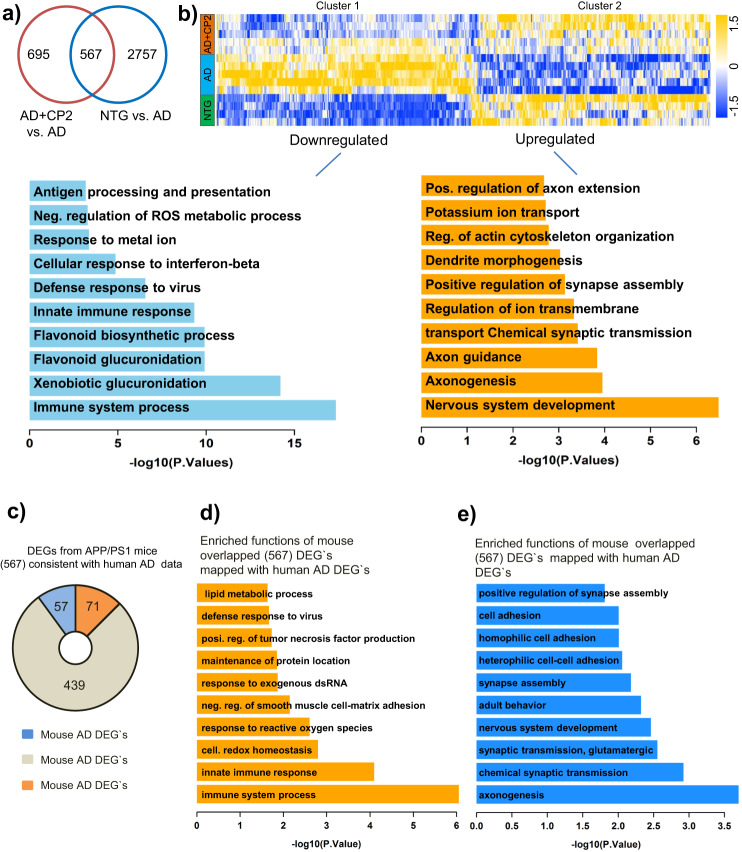
Fig. 8. Global gene expression patterns in brain tissue of APP/PS1 mice treated with CP2 relative to NTG and APP/PS1 mice.
a Venn diagram of differentially expressed genes (P < 0.05) in the brain tissue of vehicle-treated and CP2-treated NTG and APP/PS1 mice. Overlapped DEGs (567) represent specific gene pools affected by CP2 treatment. b Heatmap of the overlapped 567 genes shows two clusters where CP2 treatment reversed (upregulated or downregulated) the expression of a subset of genes in APP/PS1 mice to the levels observed in NTG littermates. Gene function enrichment analysis shows pathways associated with downregulated (Cluster 1) or upregulated (Cluster 2) genes after CP2 treatment in APP/PS1 mice. c Pie diagrams showing the number of downregulated (upper graph) and upregulated (lower graph) DEGs in vehicle-treated APP/PS1 mice that correlate with corresponding downregulated or upregulated DEGs in the human AMP-AD dataset, respectively. d Enriched functions of downregulated DEGs in vehicle-treated APP/PS1 mice that correlate with the identified downregulated DEGs in the human AMP-AD dataset. e Enriched functions of upregulated DEGs in vehicle-treated APP/PS1 mice that correlate with the identified upregulated DEGs in the human AMP-AD dataset. All mice were 23-month-old treated with CP2 or vehicle for 13–14 months. NTG, n = 4 mice per group; APP/PS1 and APP/PS1 + CP2, n = 5 mice per group.

