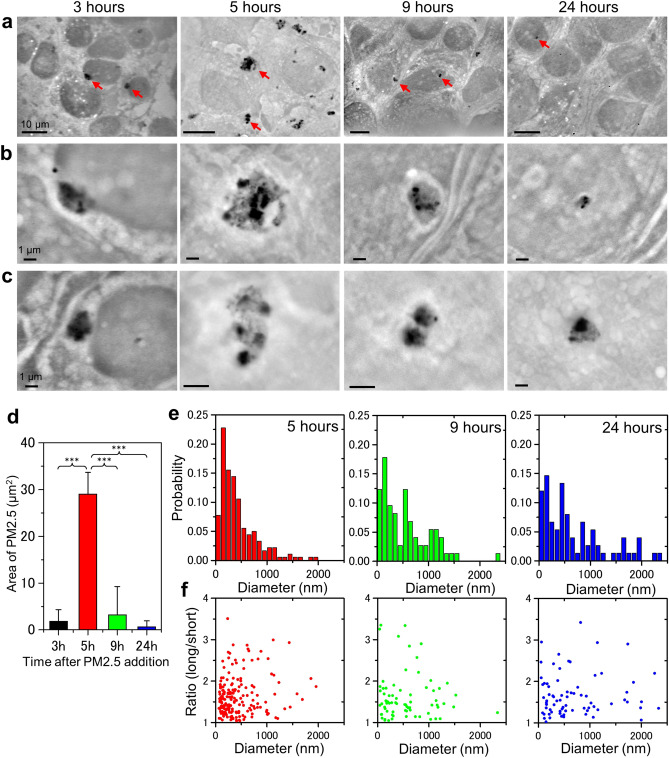
Figure 2.
SE-ADM images of OBA9 cells after the addition of PM2.5. (a) Low-magnification (1500–2500×) images of OBA9 cells at 3, 5, 9 and 24 h after addition of PM2.5. Black particles are PM2.5 aggregates. (b, c) High-magnification (b 10,000×; c 10,000–20,000×) images of the areas indicated by red arrows in (a) indicate the PM2.5 aggregates. PM2.5 aggregates appear to be covered with membrane-like structures at 5 and 9 h after the addition of PM2.5. (d) Average area of PM2.5 aggregates in cells at various time. The average area of PM2.5 aggregates in the SE-ADM image (3, 5, 9 or 24 h after addition) was calculated as described in Materials and Methods. p*** < 0.001 (e) Distribution of PM2.5 aggregate size in OBA9 cells after 5, 9 and 24 h. After 5 h, the peak of the aggregate diameter histogram was 200 nm and more than 71.4% of the aggregates were smaller than 500 nm. After 9 h, the peak of the aggregate diameter histogram shifted to larger size; 49.3% of the aggregates were larger than 500 nm. (f) Point diagrams of the average diameters versus the short and long axis ratio of PM2.5 aggregates in the cells after 5, 9 and 24 h. Scale bars, 10 μm in (a) and 1 μm in (b, c).

