Figure 5.
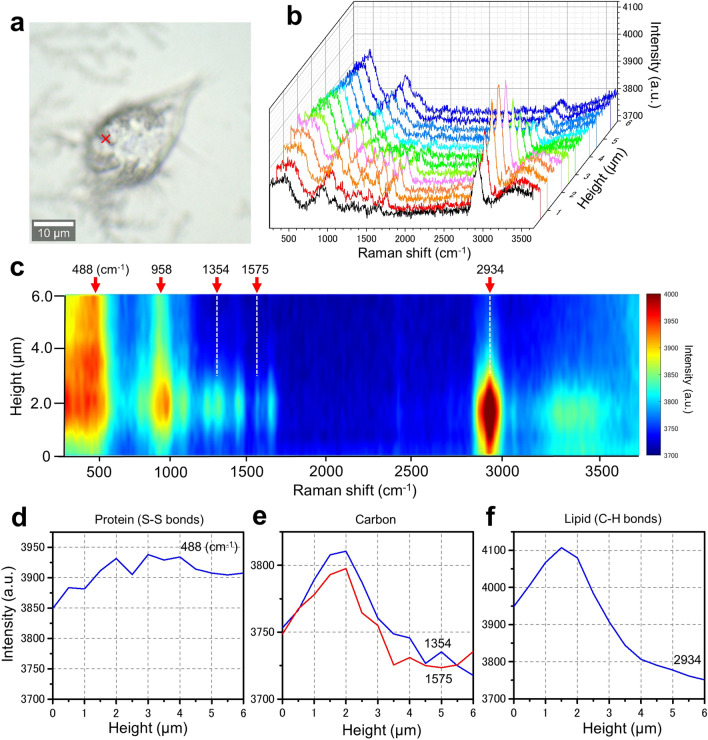
Spatial and spectrum analysis of OBA9 cells added with PM2.5 using confocal Raman spectrum microscope. (a) An optical microscopic image of OBA9 cells 5 h after the addition of PM2.5 and fixed with PFA. (b) Raman spectra of the position indicated by a red cross in the cell in (a) were obtained at 0.5 μm intervals from the glass surface to which the cell adhered (height, distance from the glass surface, 0–6 μm). (c) A coloured Raman spectrum map of (b). The horizontal and vertical axes are the Raman spectrum intensity and the height from the glass surface, respectively. In this figure, three peaks (488, 958 and 2934 cm–1) were discerned. In addition, many small peaks were recognized between 1000 and 1600 cm–1. (d) A line-plot of the protein peak of S–S bonds at 488 cm–1. This signal intensity was rather high throughout. (e) Line plots of the carbon peaks at 1354 and 1575 cm–1. These signals increased up to 2 μm height and then decreased. (f) The line plot of the lipid peak at 2934 cm–1. This signal increased up to 1.5 μm height and then decreased. Scale bar, 10 μm in (a).

