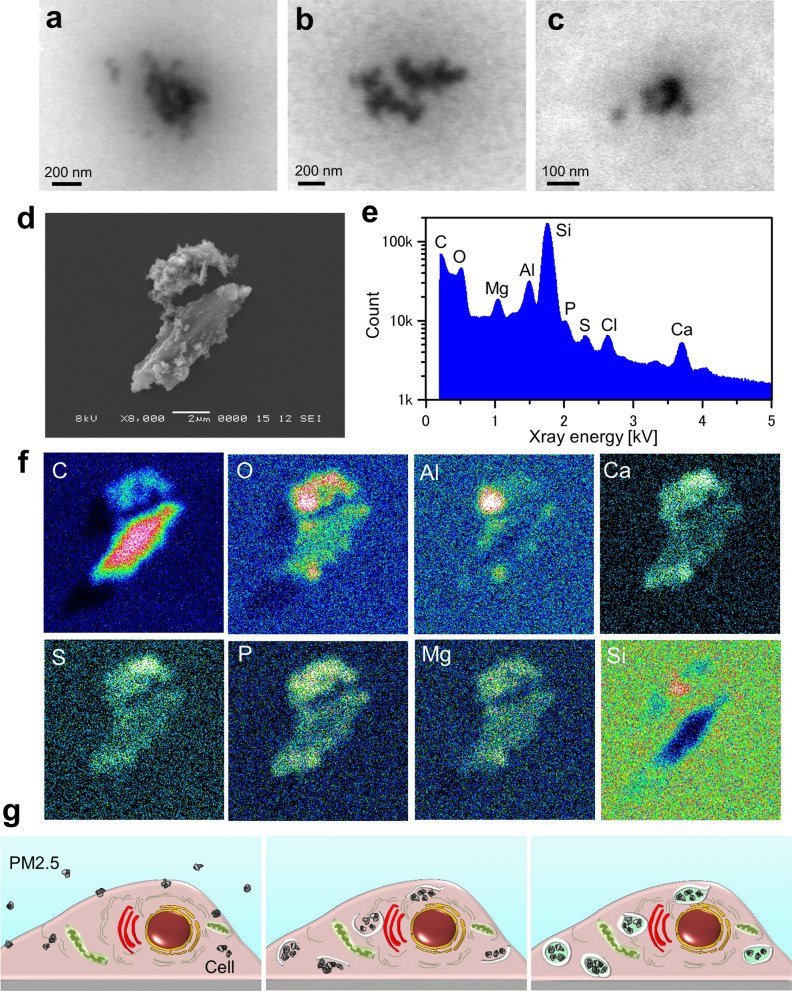
Figure 6.
SE-ADM image of PM2.5 suspension and component analysis of PM2.5 using EDX. (a, b) SE-ADM image (30,000×) of PM2.5 suspension obtained at 3 kV EB. The aggregates were seen to consist of small PM2.5 particulates. (c) A high magnification (100,000 ×) image of PM2.5 suspension obtained at 3 kV EB. (d) A single dried PM2.5 on a SiN film observed with SEM at 8000× magnification at 8 kV EB. (e) A characteristic X-ray spectrum of the PM2.5 in (d) using SEM–EDX system. The spectrum shows peaks of carbon, oxygen, magnesium, aluminium, silicon, phosphorus, sulfur, chloride and calcium. (f) The element maps of PM2.5 in (d). The lower part of the PM2.5 primarily consisted of carbon, while oxygen and aluminium were primary elements in the upper part of the PM2.5. (g) Schematic drawing of PM2.5 incorporation into a cell. Shortly after the addition of PM2.5, the particulates are attached to the cell membrane, and a few are taken into the cell (left panel). About 5 h after addition, the incorporated PM2.5 particulates are gradually aggregated and covered with white membrane-like structures (centre panel). At around 9 h, the incorporated particles are covered with the membrane-like structures (right panel). Scale bars, 200 nm in (a, b), 100 nm in (c) and 2 μm in (d).

