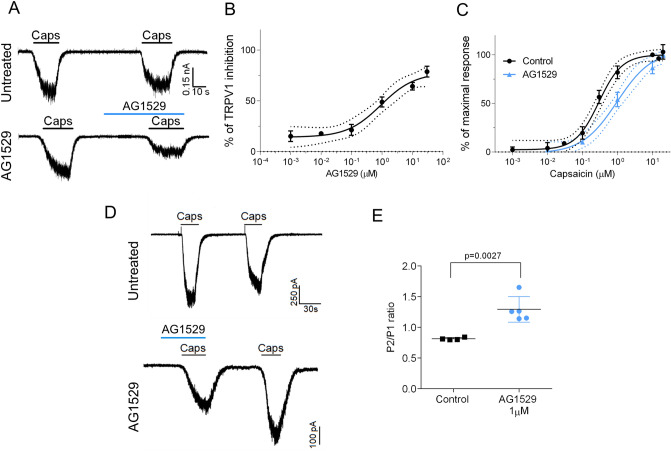
Figure 1.
AG1529 reversibly blocks capsaicin activation of hTRPV1. Electrophysiological evaluation of AG1529 on heterologously expressed hTRPV1 channel. (A) Representative capsaicin-evoked hTRPV1 current recorded at a holding potential of − 60 mV for: (i) control condition (Untreated cells), where cells were exposed to two capsaicin pulses (0.5 μM), interspersed by a washing period; and, (ii) Treated condition (AG1529 cells), where cells were exposed to a capsaicin pulse (0.5 μM), and after a washing period, cells were exposed to 1 µM AG1529 for 30 s before the second 0.5 μM capsaicin pulse. The percentage of TRPV1 inhibition was calculated as: (% inhibition) = [1 − {(Icap1 − Icap2)AG1529/(Icap1 − Icap2)Control}] × 100; (Icap1 − Icap2)Control accounts for the extend of TRPV1-induced desensitization by capsaicin (control). (B) Dose–response curve of AG1529 were fitted to a Michaelis–Menten Isotherm. The best fit provided an IC50 value of 0.92 (95% CI 0.28–3.01) µM and Hill coefficient of nH 1.31 (95% CI 0.81–1.82) (n = 32). (C) Capsaicin dose response in the absence (black) and presence of AG1549 (blue). Data were fitted to a Michaelis–Menten Isotherm. The best fitted values for capsaicin EC50 value was 0.29 (95% CI 0.20–0.35) µM (n = 29) in the absence of 1 µM AG1529 and 0.98 (95% CI 0.6–1.13) µM in its presence (blue curve, n = 21). Hill coefficient in the absence of AG1529 was 1.3 (0.9–1.6) and in its presence was 1.00 (95% CI 0.7–1.2). (D) Representative repetitive capsaicin-elicited hTRPV1 currents recordings at − 60 mV holding potential in the absence (Untreated cells) and presence of 1 µM AG1529 before the first vanilloid pulse (AG1529). (E) P2/P1 ratio denoting TRPV1 current evoked by each 0.5 μM capsaicin pulse, normalized to first vanilloid pulse, in the absence (control, n = 4) and the presence of 1 µM AG1529 (n = 5) before the first capsaicin pulse. Horizontal lines denote the duration of compound pulse. All data are expressed as mean ± SEM. Data was analysed using an unpaired, two-tail Student’s t-test. p-value is indicated.

