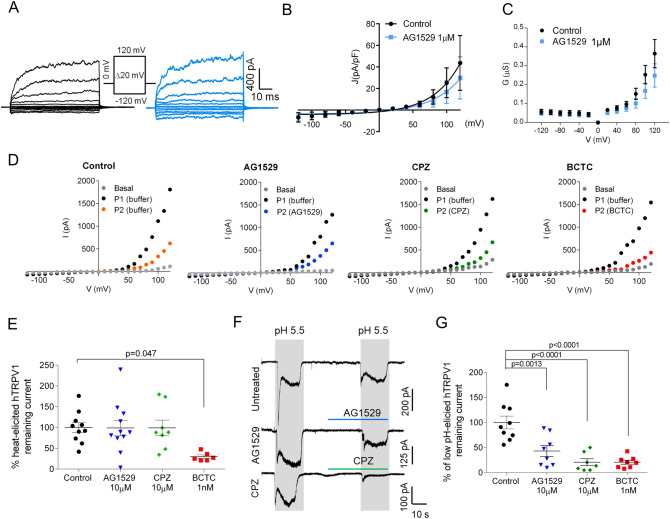
Figure 2.
AG1529 modestly affects pH, voltage and heat activation. (A) Representative hTRPV1 current recordings elicited by voltage steps protocol from − 120 mV to 120 mV in 100 ms steps of 20 mV from a holding potential of 0 mV. Black traces represent currents evoked in the absence of AG1529, and blue traces in the presence of 1 µM AG1529. (B) Current density to voltage relationship for ionic currents in the absence (n = 8) and presence of the antagonist (n = 8). (C) Conductance to voltage relationship for the ionic currents in the absence and presence of the antagonist. Conductance values were estimated from the current density values, using as Vr the x-intercept of the ionic current. (D) Representative I-V relationships of hTRPV1 ionic currents at 43 °C in the absence (control) and presence of 10 µM AG1529 (n = 11) or 10 µM capsazepine (CPZ, n = 7) or 1 nM BCTC (n = 6). Basal, denotes the ionic currents activated at 37 °C; P1 and P2, the ionic currents evoked at 43 °C in the absence and presence of the compounds, respectively. For control conditions, P2 was evoked in the absence of compounds (buffer) denoting the desensitization induced by heat and voltage. Ionic currents were recorded with a voltage ramp protocol from − 120 mV to 120 mV in 300 ms. Compounds were applied at 34 °C during 30 s before the second temperature increase to 43 °C. (E) Normalized voltage-evoked ionic current at 43 °C and + 120 mV, in the absence (control) and presence of the antagonists. Remaining TRPV1 current after P2 (desensitization) was used for normalization. Data are expressed as mean ± SEM, and were analysed using the One-Way Anova (F(3,31) = 3.5, p = 0.0269) followed by the Bonferroni´s post-hoc test, p-value for statistical difference is indicated. (F) Representative acid pH-elicited hTRPV1 ionic currents evoked by two pH 5.5 pulses in control cells (Untreated), and cells exposed to 10 µM AG1529 (AG1529) or 10 µM capsazepine (CPZ) for 30 s before the second pH pulse. Amiloride (50 µM) was used in all buffers to block endogenous ASIC channels expressed by cells. Currents were elicited at a holding V = -60 mV. (G) Normalized hTRPV1 pH-evoked inward currents elicited for control (n =9 ), 10 µM AG1529 (n = 8), 10 µM capsazepine (n = 7) and 1 nM BCTC (n =8 ). Normalized responses were estimated as (IpH2/IpH1) × 100. Grey rectangles denote the duration of the pH pulses and horizontal lines the duration of the antagonists pulses. All data is expressed as mean ± SEM. Data were analysed using the One-Way Anova (F(3,28) = 15.5, p < 0.0001) followed by the Bonferroni´s post-hoc test, p-values for statistical difference are indicated.

