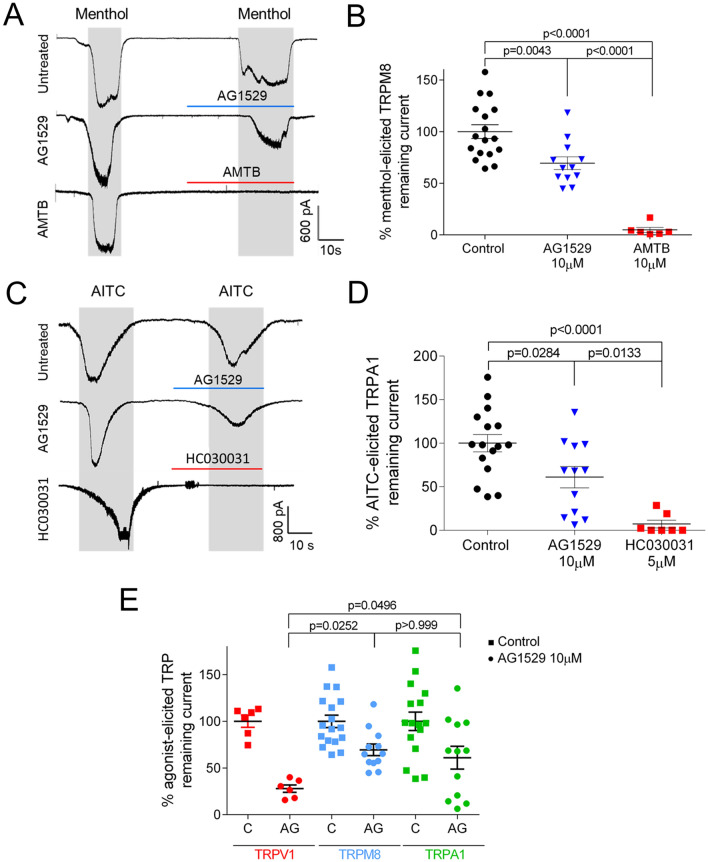
Figure 3.
AG1529 marginally inhibits TRPM8 and TRPA1 receptors. (A) Representative menthol (100 µM)-elicited hTRPM8 inward currents recorded at a holding potential of − 60 mV, for control cells (Untreated) exposed to two menthol pulses; and, for cells treated with 10 µM AG1529 (AG1529) or 10 µM AMTB (AMTB) for 30 s before the second menthol pulse. (B) Percentage of menthol-elicited TRPM8 remaining ionic current with respect to the first menthol pulse. Normalized responses were estimated as (IMenthol2/IMenthol1) × 100. (C) Representative AITC (60 µM)-elicited hTRPA1 inward currents recorded at a holding potential of − 60 mV, for control cells (Untreated) exposed to two AITC pulses; and, for cells treated with 10 µM AG1529 (AG1529) or 5 µM HC030031 (HC030031) for 30 s before the second AITC pulse. (D) Percentage of TRPA1 ionic current with respect to the first AITC pulse. Normalized responses were estimated as (IAITC2/IAITC1) × 100. Grey rectangles denote the duration of the agonist pulses and horizontal lines the duration of the antagonists pulses. All data are expressed as mean ± SEM. (E) Comparison of 10 µM AG1529 blockade of hTRPV1, hTRPM8 and hTRPA1. Data were analysed using the One-Way Anova followed by the Bonferroni´s multiple comparison post-hoc test, p-values for statistical differences are indicated. Detail data of the statistical analysis is described in the main text.

