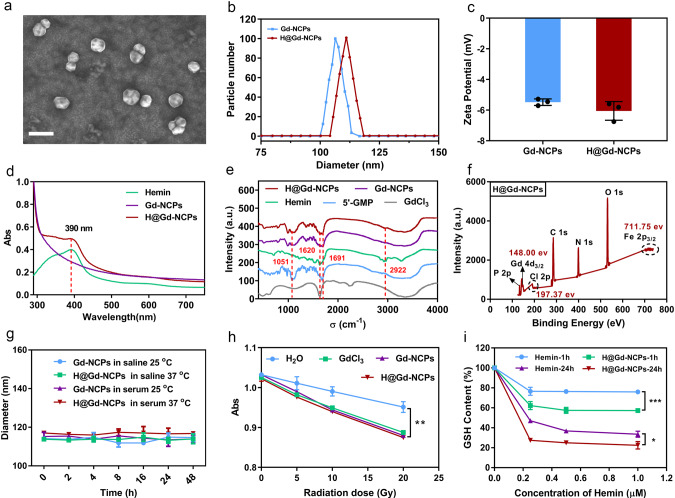
Fig. 2. Characterization of Gd-NCPs and H@Gd-NCPs.
a Ultra-high-resolution field emission scanning electron microscope (FE-SEM) imaging of H@Gd-NCPs, scale bar = 200 nm. b Particle size of H@Gd-NCPs and Gd-NCPs measured by dynamic light scattering (n = 3 biologically independent samples). c Zeta potential of Gd-NCPs and H@Gd-NCPs (n = 3 biologically independent samples). d Normalized UV-vis spectra of Hemin, Gd-NCPs and H@Gd-NCPs. e Fourier transform infrared (FT-IR) spectrum of 5′-GMP, GdCl3, Hemin, Gd-NCPs, and H@Gd-NCPs. f Qualitative element analysis of H@Gd-NCPs by X-ray photoelectron spectroscopy (XPS). g Dynamic light scattering data of Gd-NCPs and H@Gd-NCPs incubated with saline or 50% serum at 25 or 37 °C, respectively (n = 3 biologically independent samples). h Comparison of reactive oxygen species (ROS) production between H2O, GdCl3, Gd-NCPs and H@Gd-NCPs groups ([Gd3+] = 20 μM) under various radiation doses as determined by the decay of methylene blue absorption (Abs) at λ = 664 nm (n = 3 biologically independent samples, **p = 0.0049). i Concentration and time-dependent glutathione (GSH) elimination by free Hemin and H@Gd-NCPs in vitro (n = 3 biologically independent samples, ***p = 0.0001, *p = 0.0463). All experiments were repeated twice independently with similar results. All data were presented as mean ± SD. Two-sided Student’s t-test was used to calculate the statistical difference between two groups. *p < 0.05, **p < 0.01, ***p < 0.001. Source data are provided as a Source data file.

