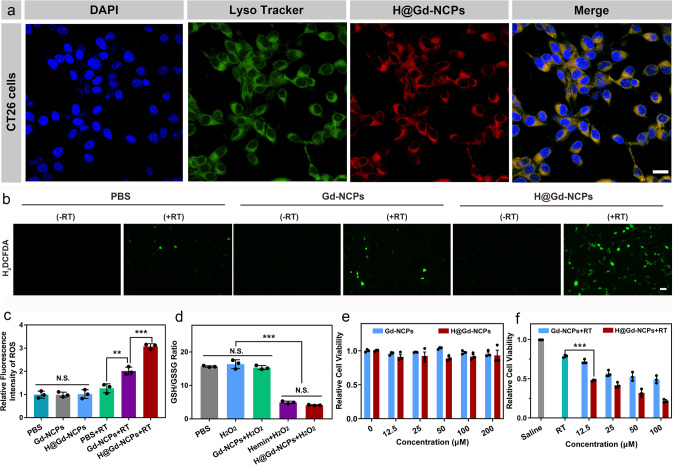
Fig. 3. Cellular uptake and radiosensitization of H@Gd-NCPs in vitro.
a Confocal laser scanning microscope (CLSM) images of CT26 cells after treatment with DAPI, Lysotracker and H@Gd-NCPs, respectively. Yellow regions indicated localization of H@Gd-NCPs in the lysosomes, scale bar = 20 μm. b Fluorescence images of CT26 cells treated with PBS, Gd-NCPs, and H@Gd-NCPs with or without 8 Gy × 1 irradiation and detected with a reactive oxygen species (ROS) probe H2DCFDA (green fluorescence) for intracellular ROS evaluation, scale bar = 200 μm. c Quantification of fluorescence based on (b) by ImageJ software (n = 3 biologically independent cells, **p = 0.0071, ***p = 0.0008). d PBS, Hemin, Gd-NCPs and H@Gd-NCPs decrease intracellular GSH/GSSG ratios in CT26 cells (n = 3 biologically independent cells, ***p = 0.0001). e The cytotoxicity of Gd-NCPs and H@Gd-NCPs without irradiation ([Gd3+] = 0, 12.5, 25, 50, 100, 200 μM) (n = 3 biologically independent cells). f The cytotoxicity of Gd-NCPs and H@Gd-NCPs against CT26 cells with 8 Gy × 1 irradiation ([Gd3+] = 0, 12.5, 25, 50, 100 μM) (n = 3 biologically independent cells, ***p = 0.0002). All experiments were repeated twice independently with similar results. All data were presented as mean ± SD. Two-sided Student’s t-test was used to calculate the statistical difference between two groups. N.S. represented non-significance, and **p < 0.01, ***p < 0.001. Source data are provided as a Source data file.

