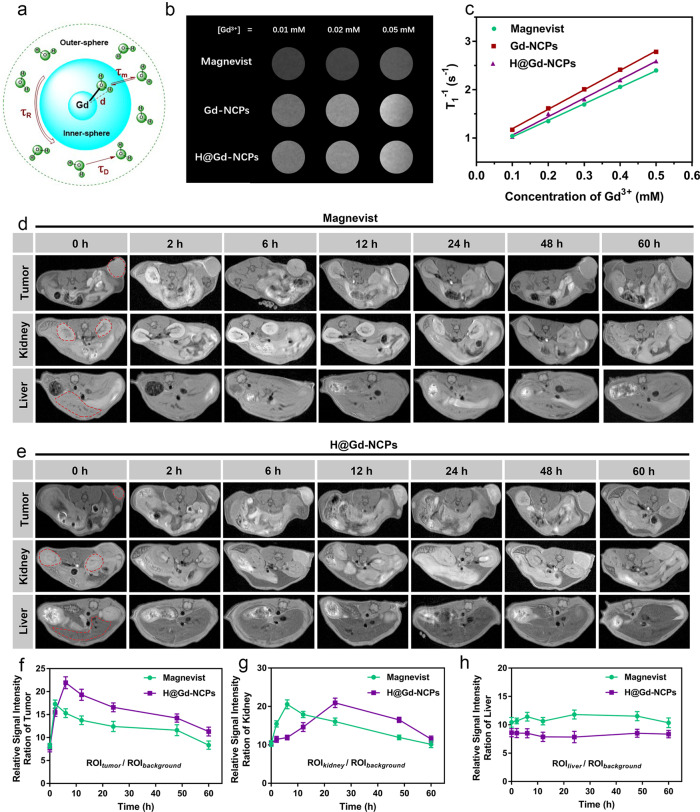
Fig. 4. Magnetic resonance imaging (MRI) in vitro and in vivo.
a Schematic diagram of MRI. b T1-weighted MR images of Magnevist, Gd-NCPs, and H@Gd-NCPs at pH 7.4 (n = 3 biologically independent samples), this experiment was repeated twice independently with similar results. c Determination of longitudinal relaxivities (r1) values for Magnevist, Gd-NCPs and H@Gd-NCPs (n = 3 biologically independent samples), this experiment was repeated twice independently with similar results. d Dynamic MR imaging after intravenous injection of Magnevist ([Gd3+] = 30 mg kg−1), and the dashed red circles indicated tumor, kidney, or liver (n = 3 biologically independent animals). e Dynamic MRI after intravenous injection of H@Gd-NCPs ([Gd3+] = 30 mg kg−1) in vivo, and the dashed red circles indicated tumor, kidney and liver, respectively (n = 3 biologically independent animals). f–h Relative background signal intensity ration of tumor (f), kidney (g) and liver (h) regions based on Magnevist MR images (d) and H@Gd-NCPs MR images (e) at different time points (n = 3 biologically independent samples). All data were presented as mean ± SD. Source data are provided as a Source data file.

