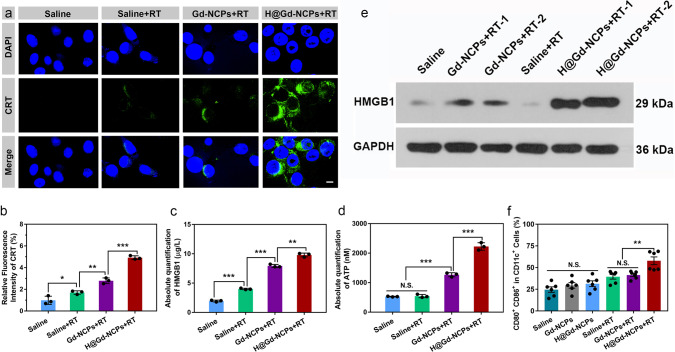
Fig. 6. Immunogenic cell death induction in vitro and in vivo.
a Immunofluorescence of CT26 colorectal tumor cells stained with calreticulin (CRT) antibody (n = 3 biologically independent cells), RT 0 or 8 Gy × 1, scale bar = 5 μm. This experiment was repeated twice independently with similar results. b Quantification of relative CRT means fluorescence intensity after different treatments (n = 3 biologically independent cells, *p = 0.0389, **p = 0.0037, ***p = 0.0003). c Detection of high mobility group protein B1 (HMGB1) release by ELISA kit (n = 3 biologically independent cells, ***p = 0.0001, ***p = 0.0001, **p = 0.0014), RT 0 or 8 Gy × 1. This experiment was repeated twice independently with similar results. d Detection of adenosine triphosphate (ATP) secretion by luciferin-based ATP assay kit (n = 3 biologically independent cells, ***p = 0.0001, ***p = 0.0003), RT 0 or 8 Gy × 1. This experiment was repeated twice independently with similar results. e Western blot of HMGB1 in CT26-bearing mice tumor tissues after various treatments, the tumor tissues were harvested 48 h after radiotherapy (0 or 6 Gy × 1, n = 3 biologically independent animals). This experiment was repeated once independently with similar results. f Flow cytometry analysis of dendritic cells (DCs) maturation in tumor-draining lymph nodes (TDLNs), the TDLNs were harvested 5 days after radiotherapy (0 or 6 Gy × 1, n = 6 biologically independent animals, **p = 0.0063). All data were presented as mean ± SD. Two-sided Student’s t-test was used to calculate the statistical difference between two groups. N.S. represented non-significance, and *p < 0.05, **p < 0.01, ***p < 0.001. Source data are provided as a Source data file.

