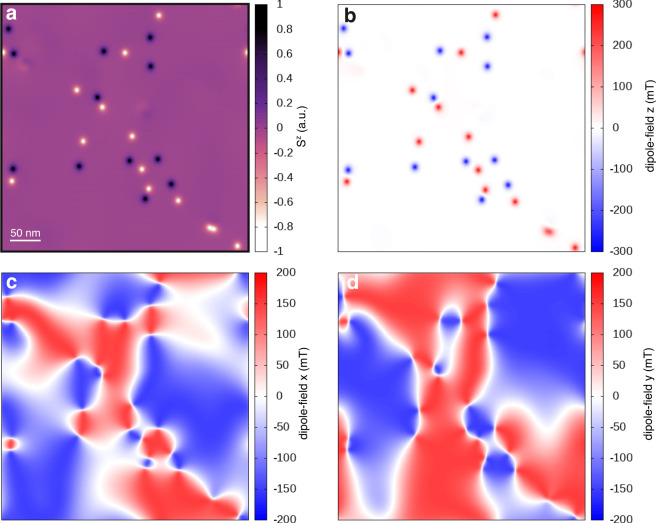
Fig. 4. Dipolar interactions driven the formation of merons and antimerons.
a Snapshot of one of the spin dynamics at 0 K and zero magnetic field showing the out-of-plane spin component Sz (color map) throughout the surface of monolayer CrCl3. b–d Projection of the dipole–dipole interactions along of z, x, and y directions, respectively, on the snapshot in a. The dipole fields are quantified in mT with positive (red) and negative (blue) magnitudes in the color scale. The scale bar of 50 nm is common to all panels.

