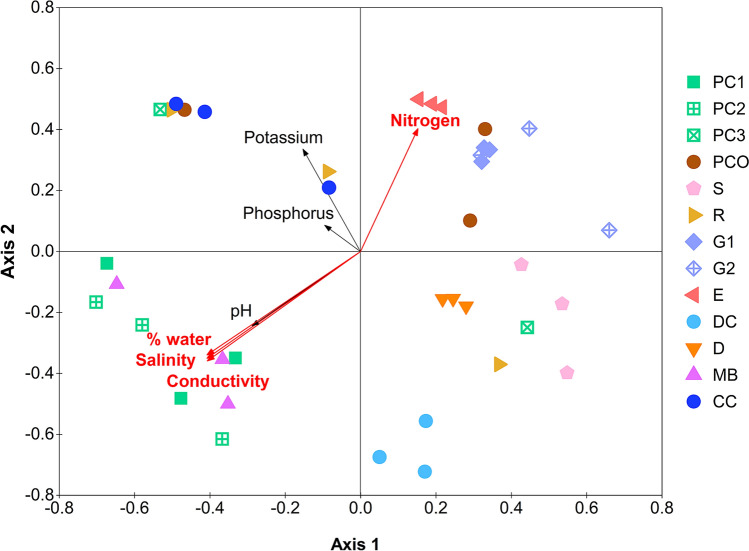
Figure 5.
Relationship among bacterial communities via NMDS constructed from thetayc distance coefficients among quantitative microbiota (stress value = 0.15, R2 = 0.86), and Pearson's correlation with nutrients and physiochemical properties (AMOVA, p < 0.001). A vector direction and length represented the direction and strength of that nutrient or physiochemical factor to the communities. A red arrow with red font indicated a statistically significant correlation (p < 0.05).

