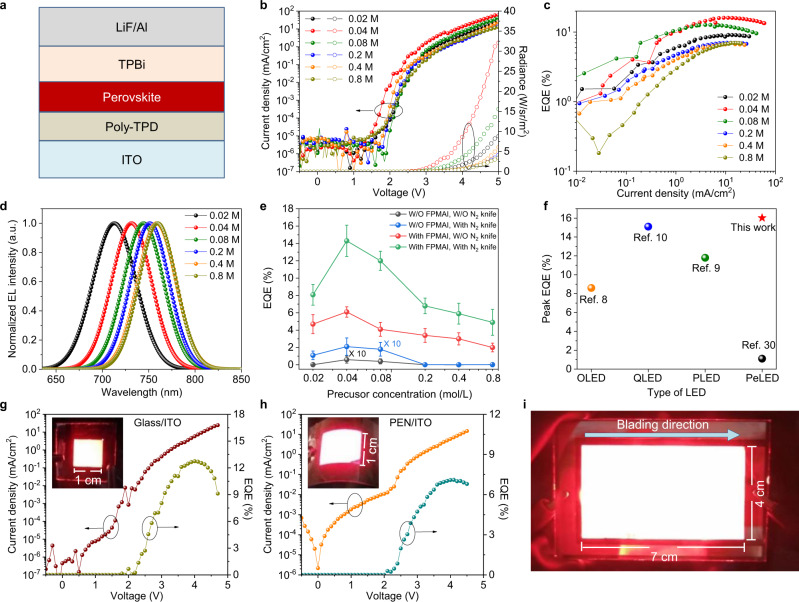
Fig. 5. Performance of doctor-bladed PeLEDs.
a Device structure of PeLEDs. b–d Current density–voltage–radiance (J–V–R) curves (b), EQE (c), and EL spectra (d) of the PeLEDs fabricated with FPMAI additive and N2 knife. e EQE statistics of the PeLEDs fabricated by different methods. The EQE statistics of PeLEDs made from 0.04 M solution with FPMAI additive and N2 knife is based on 20 devices, and other categories are based on 10 devices. Error bars represent standard deviation. f Comparison of the peak EQE of OLEDs, QLEDs, PLEDs, and PeLEDs fabricated by blade-coating. g, h Current density and EQE curves of doctor-bladed PeLEDs on glass/ITO (g) and PEN/ITO (h) with a device area of 1 × 1 cm2. Inset is photo image of the PeLED. i Photo image of an ultra large-area PeLED with a device area of 4 × 7 cm2.

