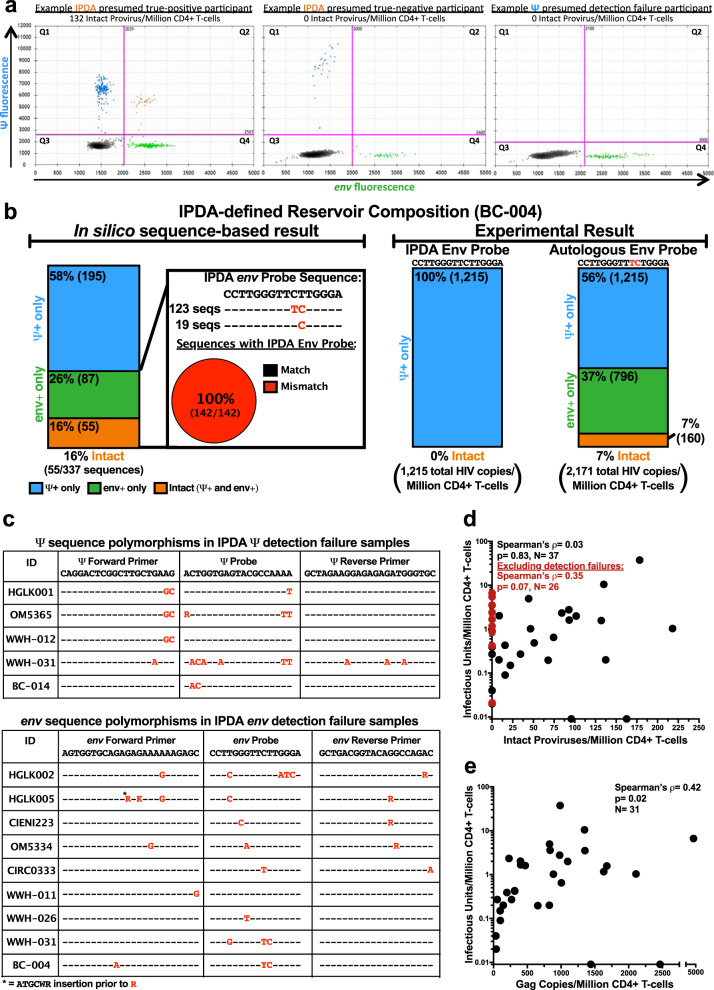
Fig. 1. Interindividual HIV diversity can lead to detection failure by the IPDA.
a IPDA 2D ddPCR plots. Ψ-single-positive (Q1, blue), Ψ- and env- double-positive (Q2, orange), double-negative (Q3, gray) and env single-positive (Q4, green) events for an IPDA true-positive individual, a presumed IPDA true-negative individual and a presumed case of Ψ detection failure. Plots show merge of four replicate wells. b IPDA detection failure due to interindividual HIV diversity. In silico analysis of 337 linked Ψ and env probe sequences from proviral DNA of participant BC-004, who originally failed detection in env, revealed single nucleotide mismatches (red, inset) to the IPDA env probe. These sequences yielded in silico Ψ+(blue), env+(green) and intact (Ψ+env+; orange) provirus frequencies as shown on left. Experimental results using the published IPDA and autologous env probe are shown on right. Source data, including the 337 Ψ and env probe sequences and their classifications, are provided in the Source Data File. c HIV polymorphisms in IPDA primer and probe region sequences for participants with Ψ or env detection failure. Hyphens (-) indicate matches to the IPDA primer or probe; red letters indicate mismatches; asterisk indicates insertion location. d Correlation between reservoir size as measured by IPDA (Intact Proviruses/Million CD4 + T-cells) and QVOA (Infectious Units/Million CD4 + T-cells). When data from all 37 virally-suppressed participants are included, Spearman’s ρ = 0.03 with a two-tailed p = 0.83. After excluding 11 presumed IPDA detection failures (red datapoints), Spearman’s ρ = 0.35 with a two-tailed p = 0.07. Two individuals for whom no replication-competent viruses were detected (IUPM = 0) are plotted on the X-axis. QVOA replicates are detailed the methods; IPDA data represent the point estimate from four merged technical replicates per sample. Source data are provided in the Source Data file. e Correlation between QVOA and HIV gag copies/million CD4 + T-cells. Analysis comprises 31 unique participants, yielding Spearman’s ρ = 0.42, two-tailed p = 0.02. Two individuals for whom no replication-competent viruses were detected (IUPM = 0) are plotted on the X-axis. HIV gag copies report the point estimate from at least four merged technical replicates for each sample. Source data are provided in the Source Data File.

