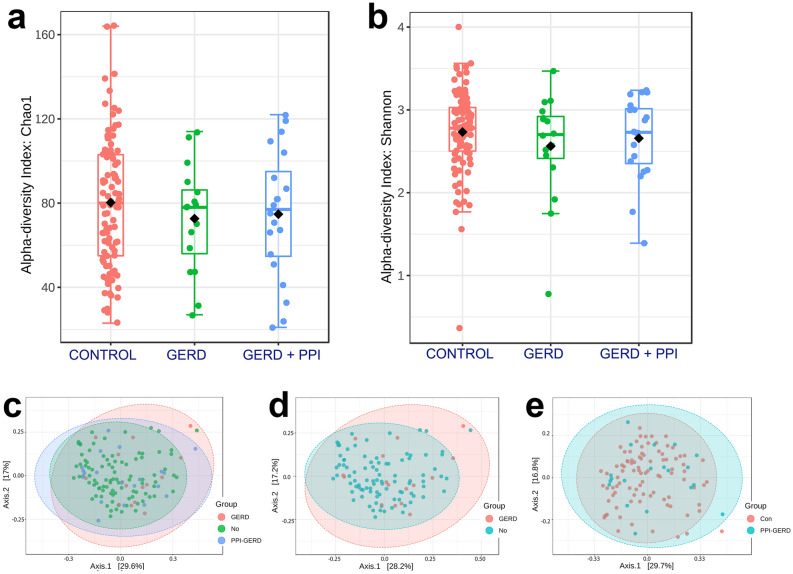
Figure 1.
Box plot of (a) Chao1 index of control, GERD patients not using PPI, and GERD patients using PPI. Comparison of the control to GERD patients not using PPI, p < 0.302, and the control comparison to GERD using PPI, p < 0.513; and (b) Shannon index in controls versus GERD patients not using PPI, p < 0.330 and versus GERD using PPI, p < 0.571. Principal coordinate analysis (PCoA) of saliva microbiome profiles of (c) all 3 groups; (d) negative controls versus GERD patient not using PPI; and (e) negative controls versus GERD patients using PPI reveal some differences in microbiota community structure in the GERD group not using PPI.

